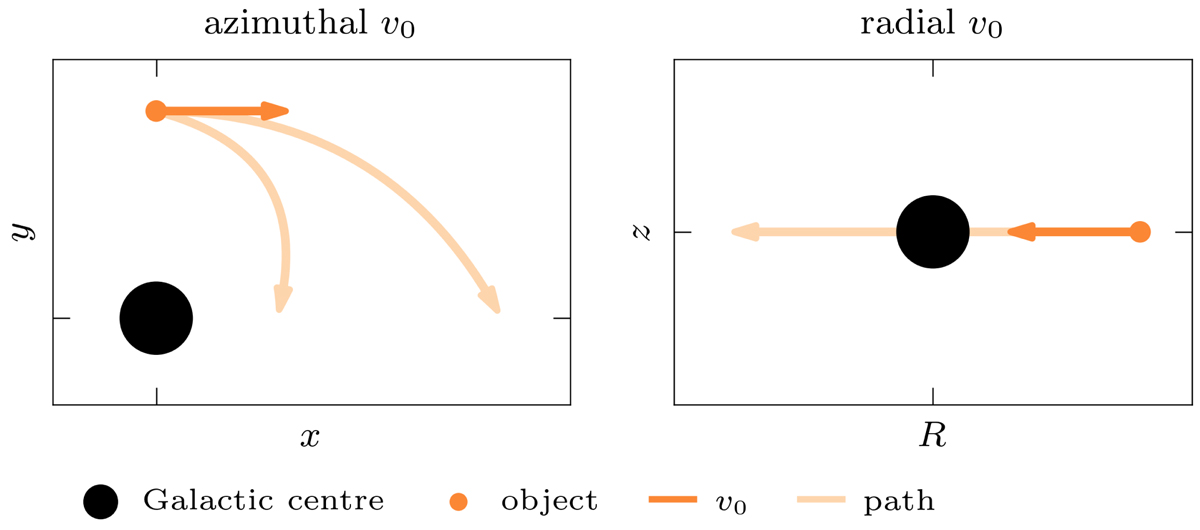
Fig. 8.
Download original image
Schematic diagrams of hypothetical paths (light orange curves) of objects (orange dots) resulting from an initial velocity (orange arrows) completely in the azimuthal (left panel) or negative radial (central panel) direction. The shown initial velocity vectors and paths are merely qualitative estimates of possible paths that potentially contribute to the initial acceleration of vR (as found in Fig. 5). In Fig. 9, we show examples of orbits that are a result of initial velocities in these directions.
Current usage metrics show cumulative count of Article Views (full-text article views including HTML views, PDF and ePub downloads, according to the available data) and Abstracts Views on Vision4Press platform.
Data correspond to usage on the plateform after 2015. The current usage metrics is available 48-96 hours after online publication and is updated daily on week days.
Initial download of the metrics may take a while.