Fig. 5.
Download original image
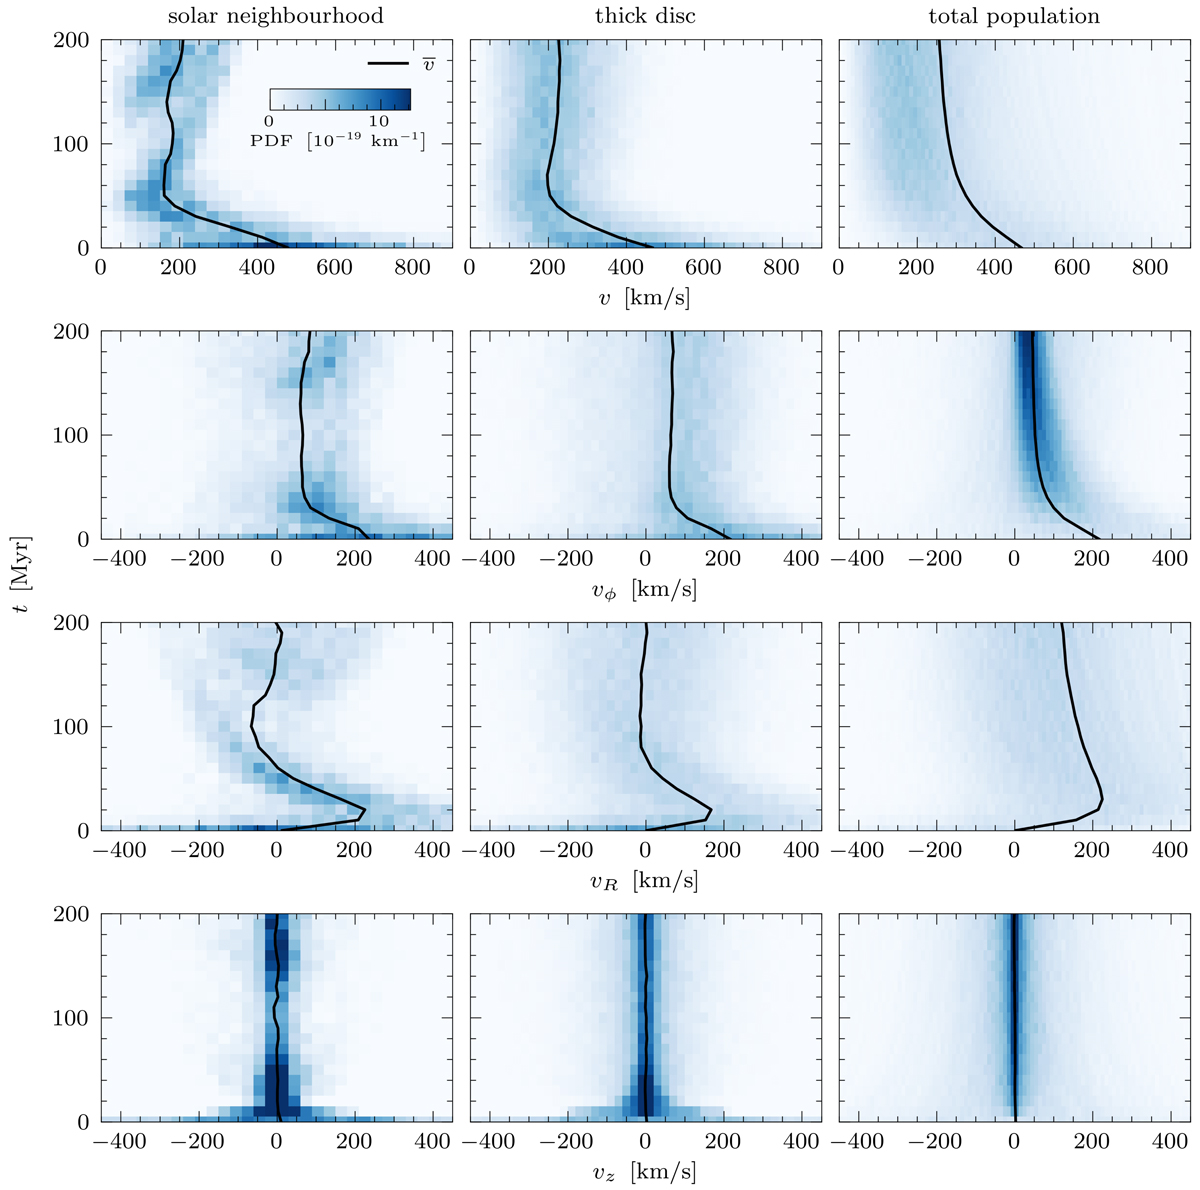
Evolution of the galactocentric velocity (v) and the cylindrical components of the velocity vector (vϕ, vR, and vz). The figure shows normalised distributions, in 2D histograms with time bins of 10 Myr and velocity bins of 30 km s−1, 20 km s−1, and 10 km s−1 for the solar neighbourhood, the thick disc, and the total population, respectively. For clarity, we set the maximum values of the distributions at 4 × 10⁻⁵ s km−1 Myr−1 ≈ 13 × 10−19 km−1, even though the peaks in the last row exceed this maximum to a certain degree. The black lines show the mean velocities at each point in time.
Current usage metrics show cumulative count of Article Views (full-text article views including HTML views, PDF and ePub downloads, according to the available data) and Abstracts Views on Vision4Press platform.
Data correspond to usage on the plateform after 2015. The current usage metrics is available 48-96 hours after online publication and is updated daily on week days.
Initial download of the metrics may take a while.