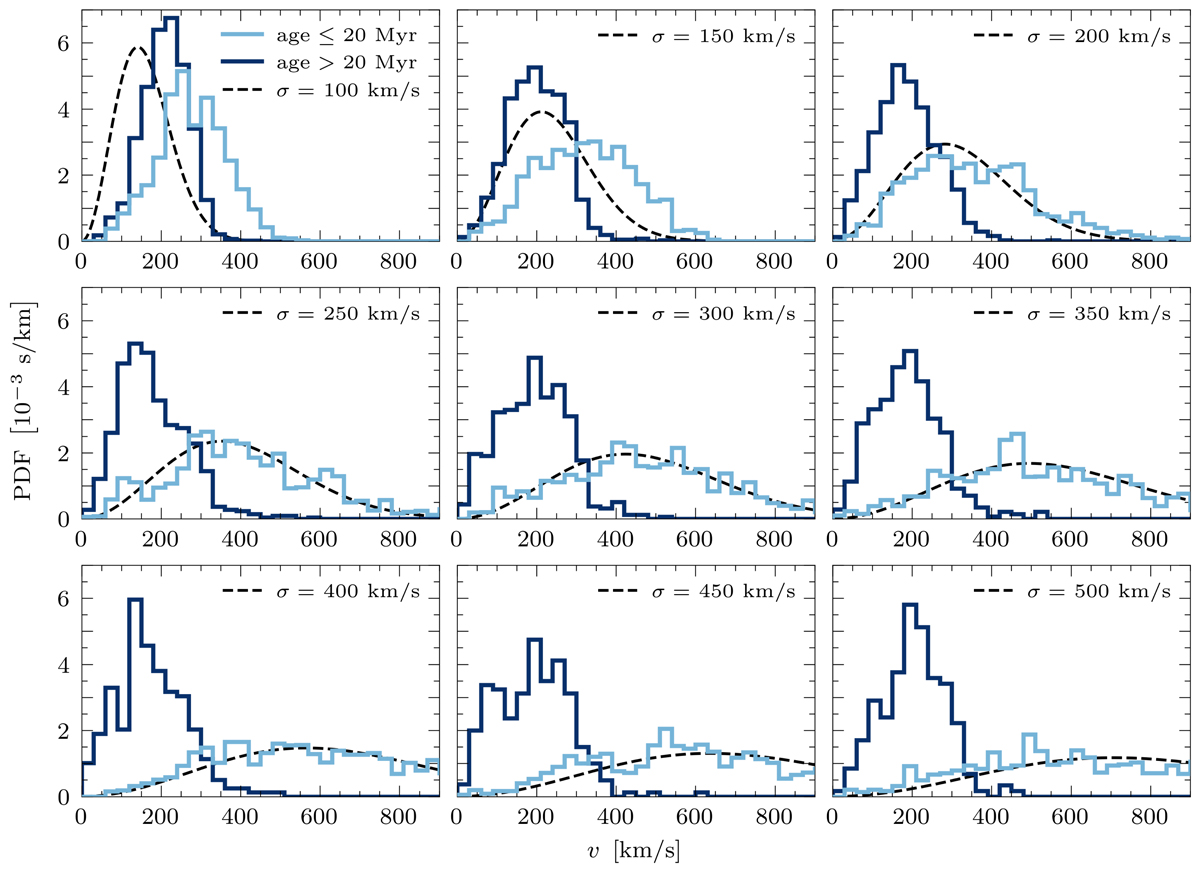
Fig. B.1.
Download original image
Our simulation, but for 103 point masses instead of 104, and for varying kick distributions. Similarly to the results shown in Fig. 2, we evaluate the points below 20 Myr every 1 Myr (light blue curve) and after 20 Myr every 10 Myr, which provides the velocity distributions shown in normalised histograms with a bin width of 30 km/s. For the kick distributions, we use Maxwellians (Eq. B.1) with a σ varying from 100 km/s to 500 km/s, with intervals of 50 km/s.
Current usage metrics show cumulative count of Article Views (full-text article views including HTML views, PDF and ePub downloads, according to the available data) and Abstracts Views on Vision4Press platform.
Data correspond to usage on the plateform after 2015. The current usage metrics is available 48-96 hours after online publication and is updated daily on week days.
Initial download of the metrics may take a while.