Fig. 10.
Download original image
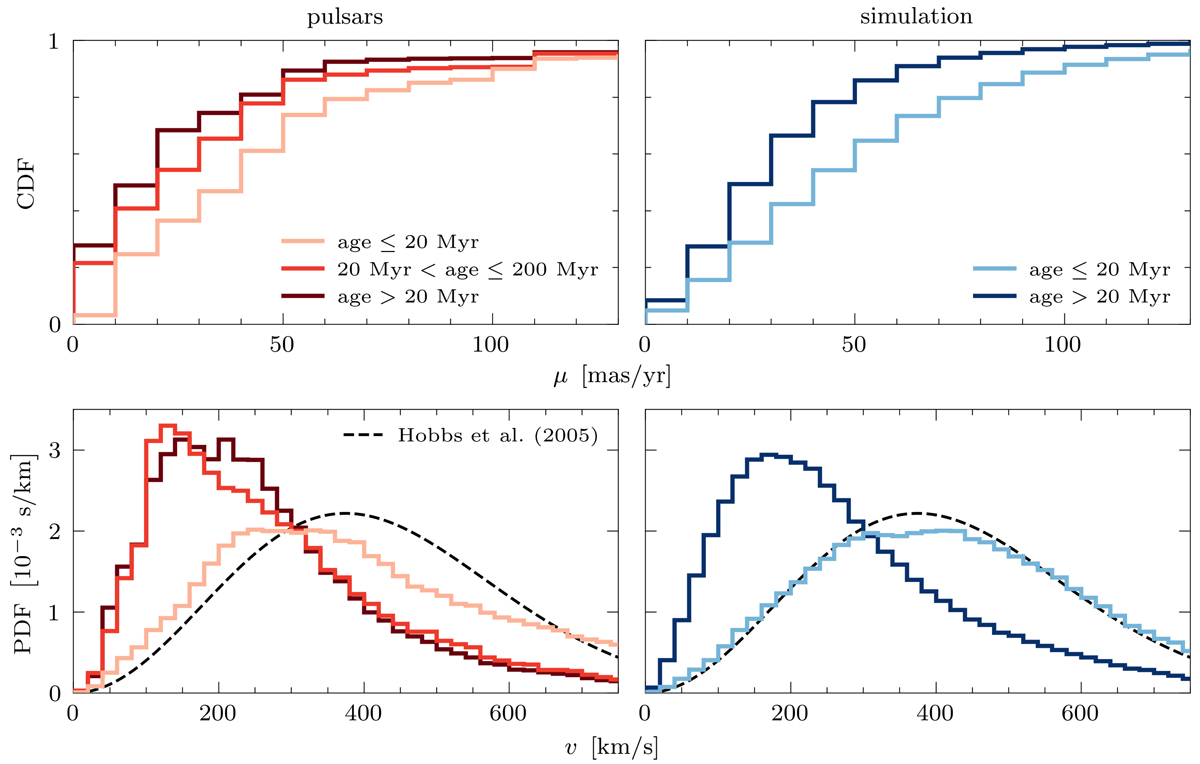
Comparison between pulsar data and our simulation. The pulsar data are taken from the ATNF catalogue (Manchester et al. 2005), as described in the text. The top-left panel shows the observed proper motions (μ) of pulsars within 2 kpc of the Solar System, for ages below 20 Myr (light red, consists of 72 pulsars), between 20 Myr and 200 Myr (red, consists of 22 pulsars), and above 20 Myr (dark red, consists of 49 pulsars), in cumulative histograms with a bin width of 10 mas yr−1. In the top-right panel, we show the proper motions of the simulated objects in the solar neighbourhood, for ages below 20 Myr (light blue) and above 20 Myr (dark blue), in a similar histogram. The bottom-left panel shows the sum of the Monte Carlo estimated posteriors of the pulsar galactocentric velocities (v), in histograms with a bin width of 20 km s−1, together with the Hobbs et al. (2005) kick distribution. These distributions also include pulsars at distances greater than 2 kpc from the Solar System, resulting in populations with ages below 20 Myr, between 20 Myr and 200 Myr, and above 200 Myr with sizes of 179, 45, and 101, respectively. The bottom-right panel shows similar histograms, for the total population in our simulation, as is also shown in Fig. 2. Similarly to Fig. 2, we evaluate our simulation every 1 Myr for the first 20 Myr, after which we evaluate the simulation every 10 Myr.
Current usage metrics show cumulative count of Article Views (full-text article views including HTML views, PDF and ePub downloads, according to the available data) and Abstracts Views on Vision4Press platform.
Data correspond to usage on the plateform after 2015. The current usage metrics is available 48-96 hours after online publication and is updated daily on week days.
Initial download of the metrics may take a while.