Fig. 6.

Download original image
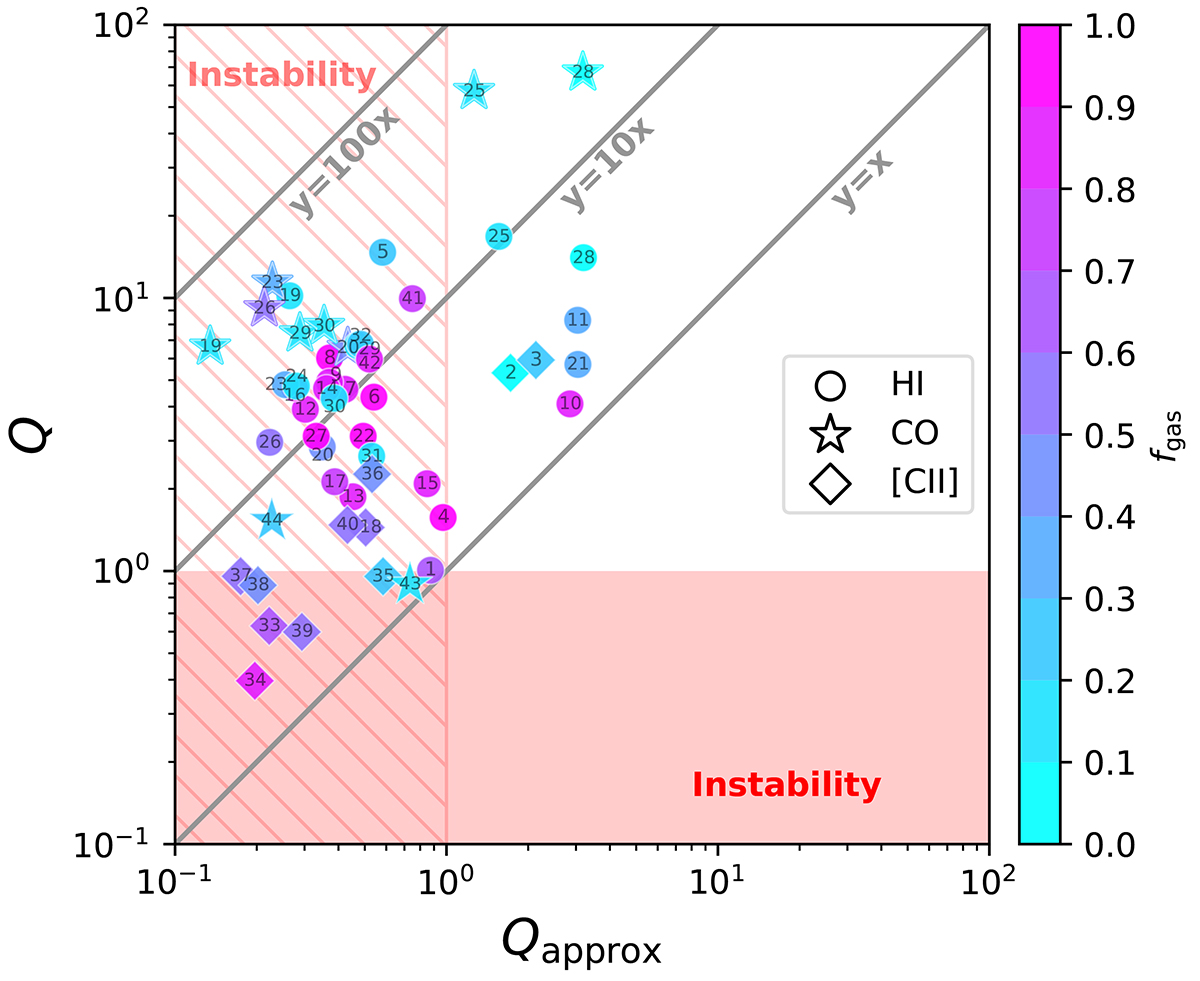
Comparison between Qapprox (Eq. (23)) and the median value of Q(R) (Eq. (1)). The different symbols indicate the gas tracer, with circles for HI, stars for CO, and diamonds for [CII]. The symbols are coloured according to the mass fraction of cold gas with respect to baryons and the numbers indicate the galaxy ID (see Table 1). The areas in shaded red and hatched show the instability regions for Q < 1 and Qapprox < 1, respectively. The grey solid lines represent the different ratios between the values on y and x axes. This figure shows that Eq. (23) strongly underestimate Q.
Current usage metrics show cumulative count of Article Views (full-text article views including HTML views, PDF and ePub downloads, according to the available data) and Abstracts Views on Vision4Press platform.
Data correspond to usage on the plateform after 2015. The current usage metrics is available 48-96 hours after online publication and is updated daily on week days.
Initial download of the metrics may take a while.


