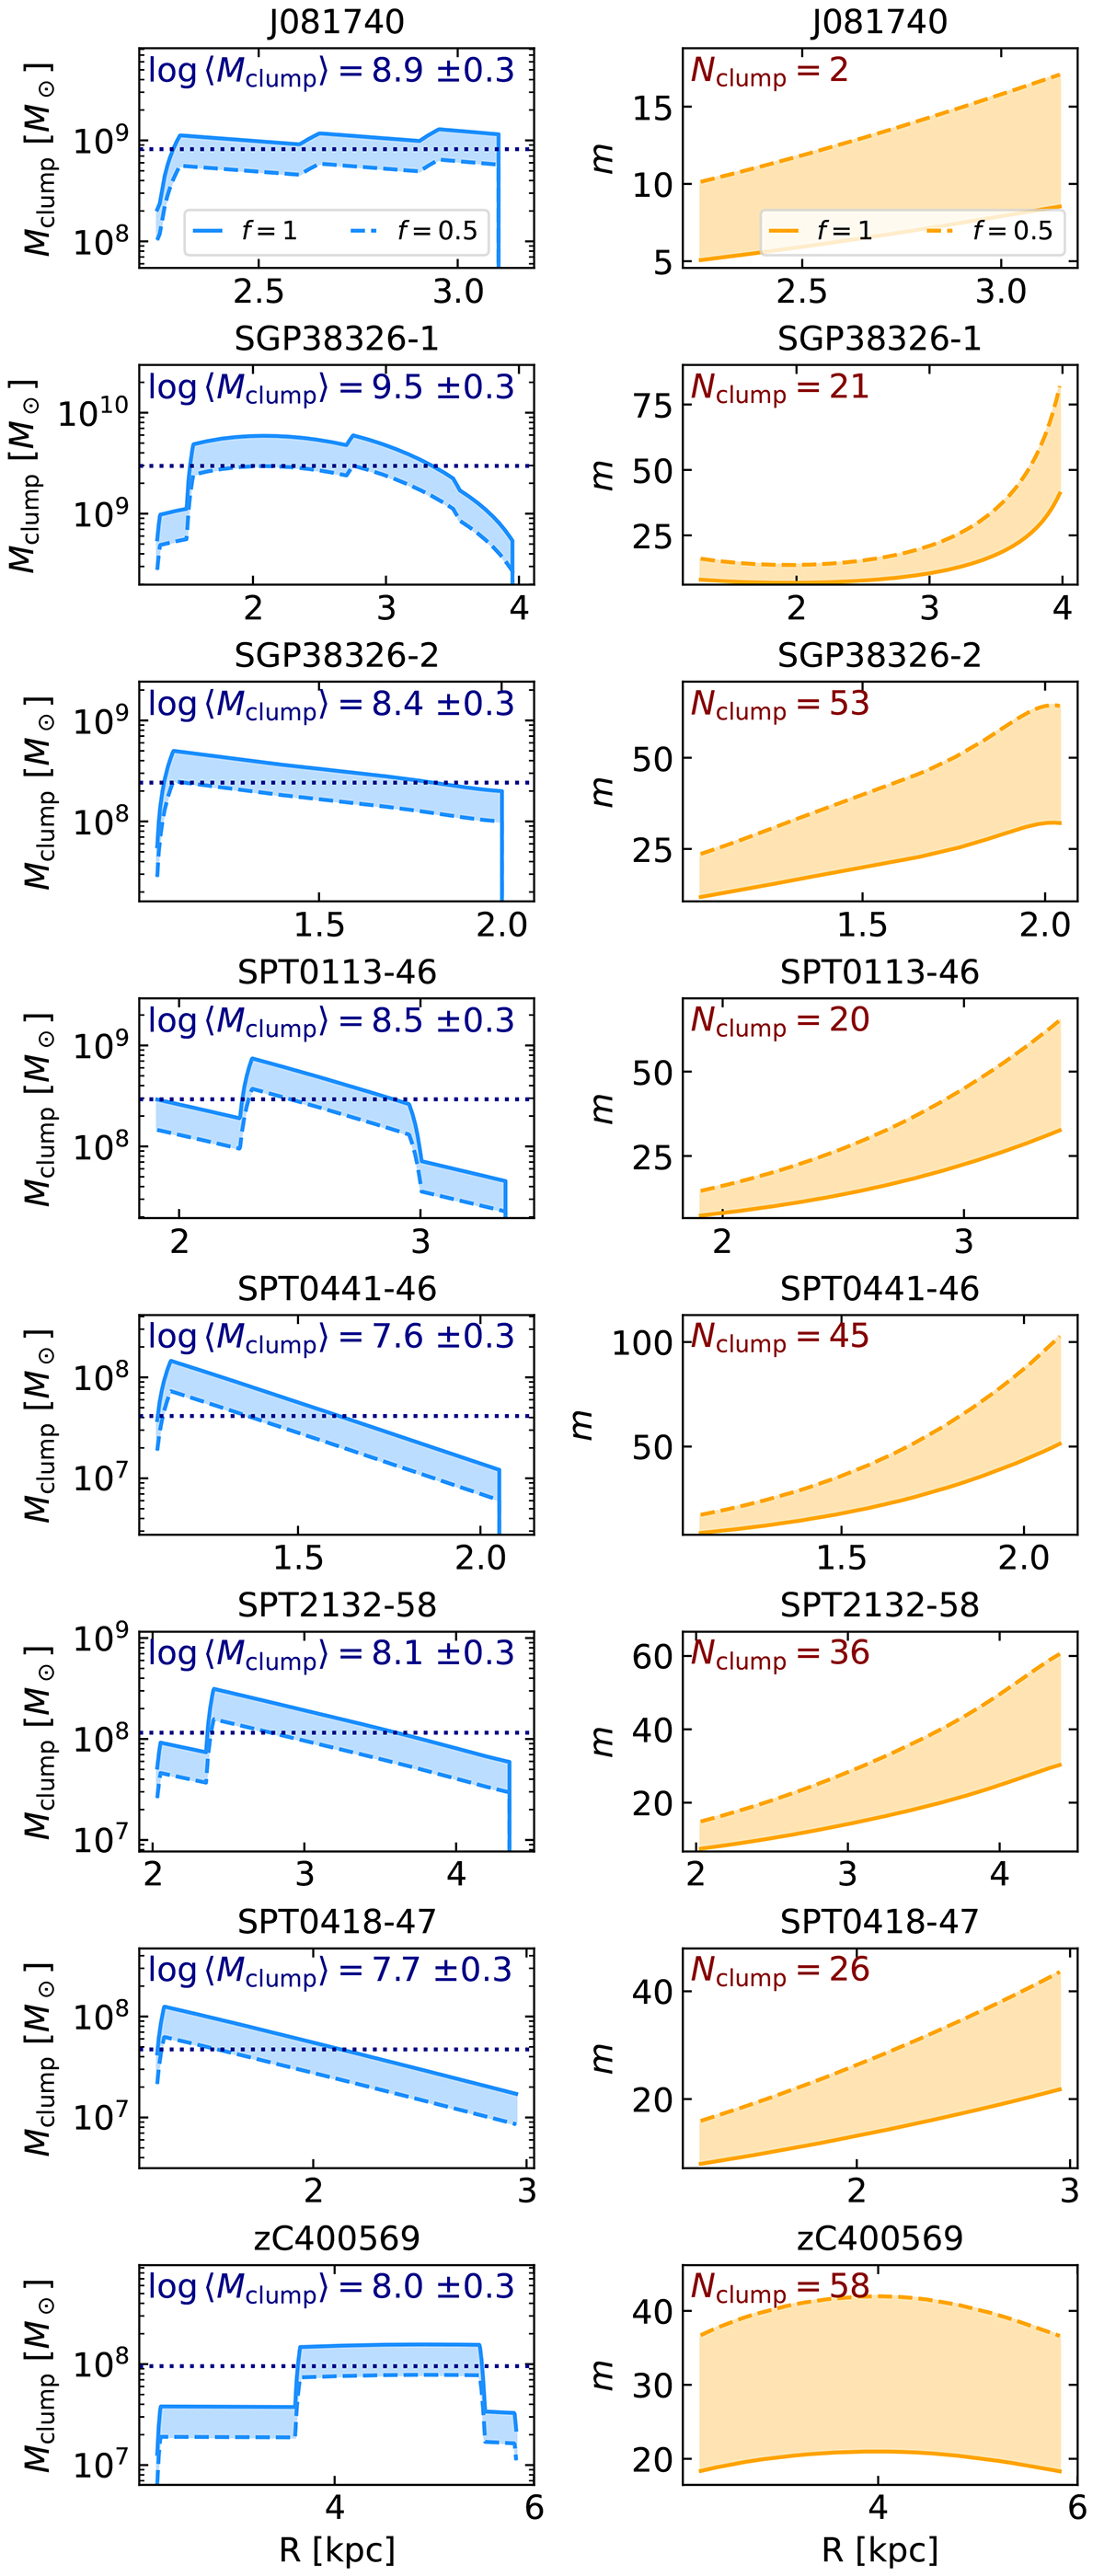
Fig. 5.
Download original image
Radial trends of the expected mass of clumps (left) and the most unstable effective azimuthal wavenumber (right) for the galaxies with Q3D < 1. The shaded areas show the range of values for 0.5 ≤ f ≤ 1 (see Sect. 4.4 for details). In each panel, we also report the expected clump mass ⟨Mclump⟩ (blue dotted line) with the uncertainty given by 0.5 ≤ f ≤ 1 and the corresponding expected number of clumps Nclump.
Current usage metrics show cumulative count of Article Views (full-text article views including HTML views, PDF and ePub downloads, according to the available data) and Abstracts Views on Vision4Press platform.
Data correspond to usage on the plateform after 2015. The current usage metrics is available 48-96 hours after online publication and is updated daily on week days.
Initial download of the metrics may take a while.