Open Access
Fig. 4.
Download original image
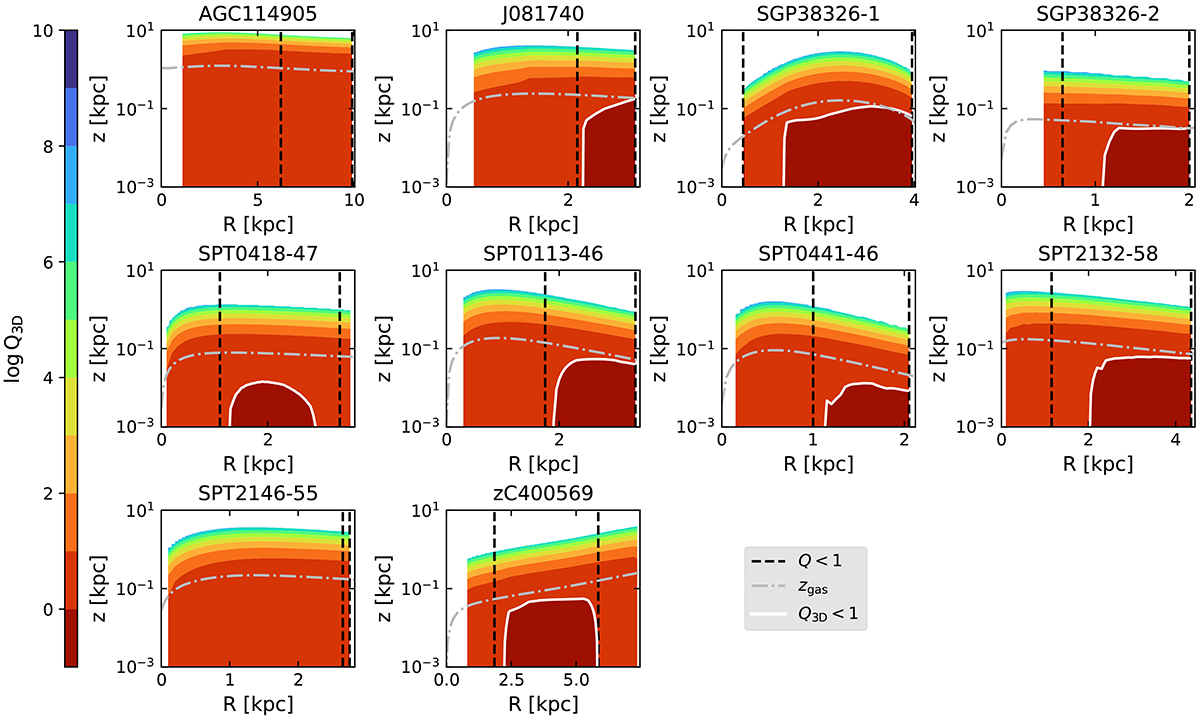
Maps of Q3D(R, z) for the galaxies in our sample having gravitationally unstable regions (delimited by the black dashed lines) according to the Q criterion. The white contour encompasses the region that is locally unstable when Q3D criterion is adopted. The gray dash-dotted curve represents the gas disc scale height zgas.
Current usage metrics show cumulative count of Article Views (full-text article views including HTML views, PDF and ePub downloads, according to the available data) and Abstracts Views on Vision4Press platform.
Data correspond to usage on the plateform after 2015. The current usage metrics is available 48-96 hours after online publication and is updated daily on week days.
Initial download of the metrics may take a while.