Open Access
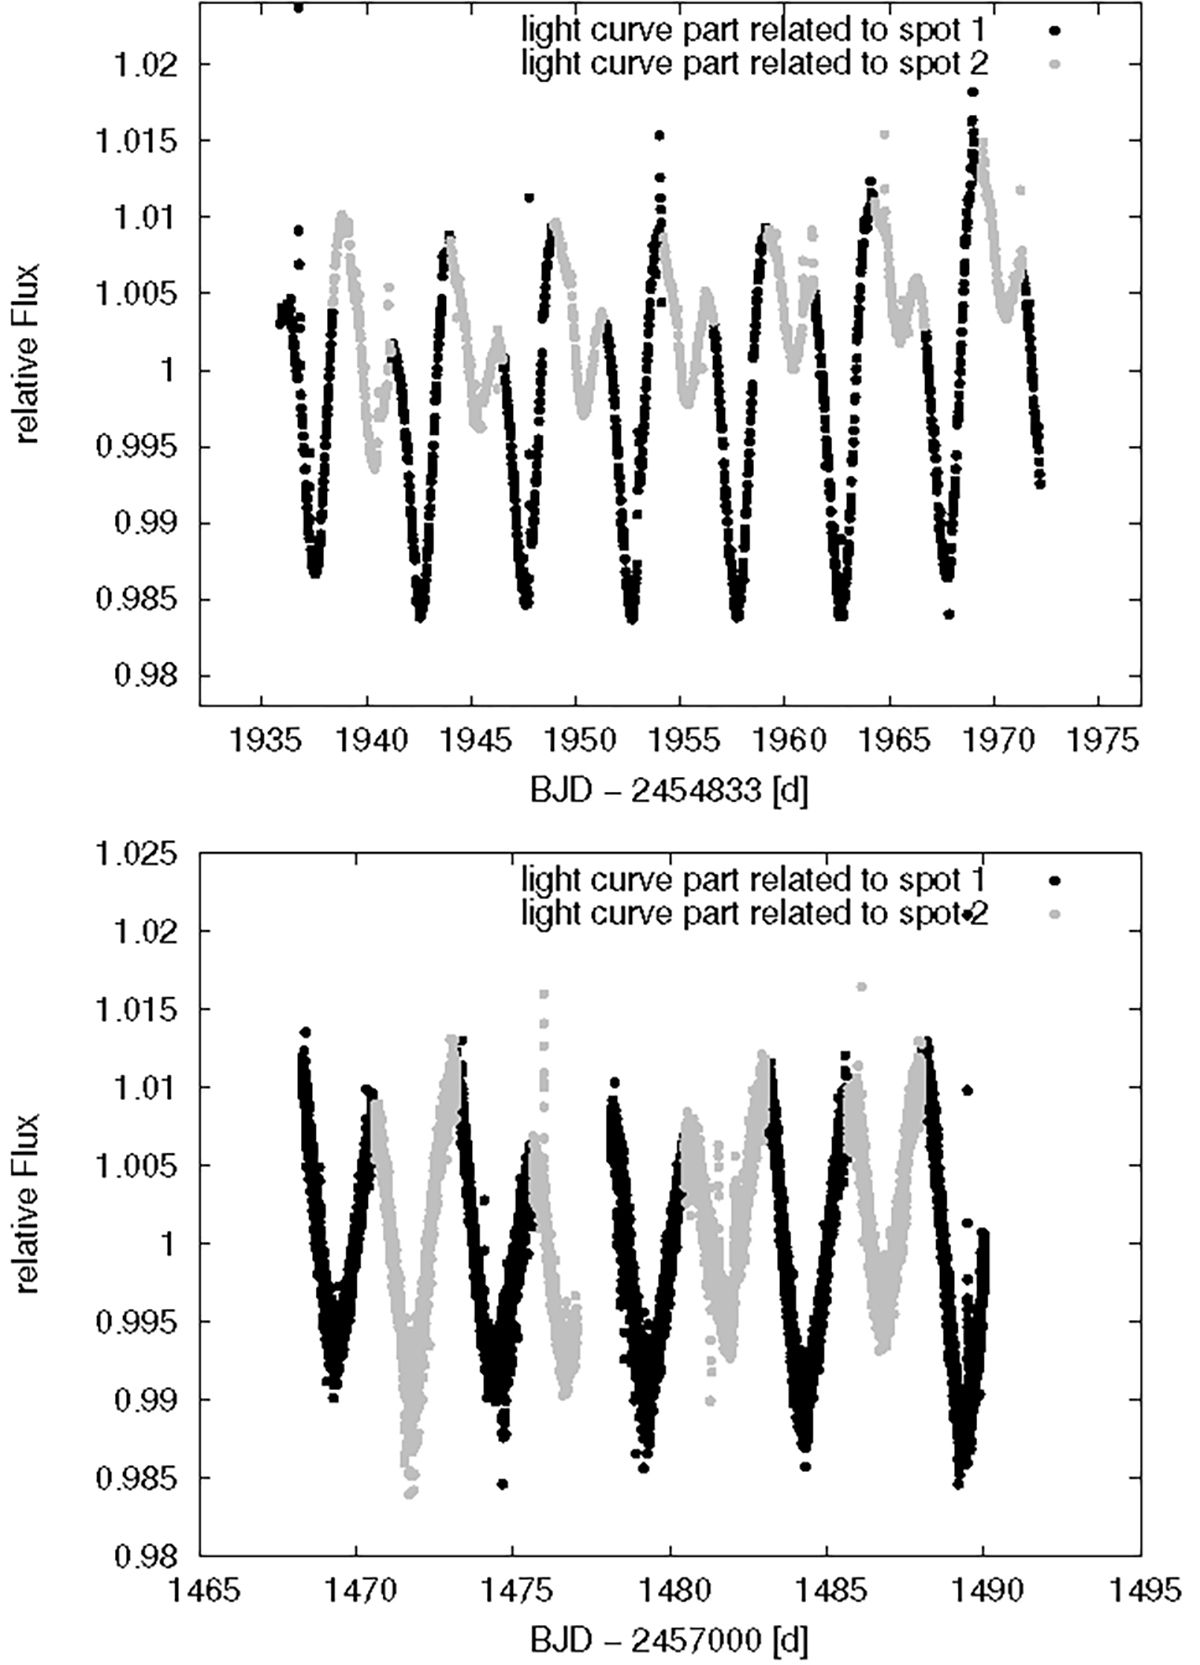
Fig. 8.
Download original image
Light curve of EPIC 202059229 of K2 (top) and TESS (bottom). Shown in black and in gray are the light-curve intervals related to Spot 1 and Spot 2, respectively, which were used for the estimation of the differential rotation. The rotation period was determined separately for each interval.
Current usage metrics show cumulative count of Article Views (full-text article views including HTML views, PDF and ePub downloads, according to the available data) and Abstracts Views on Vision4Press platform.
Data correspond to usage on the plateform after 2015. The current usage metrics is available 48-96 hours after online publication and is updated daily on week days.
Initial download of the metrics may take a while.