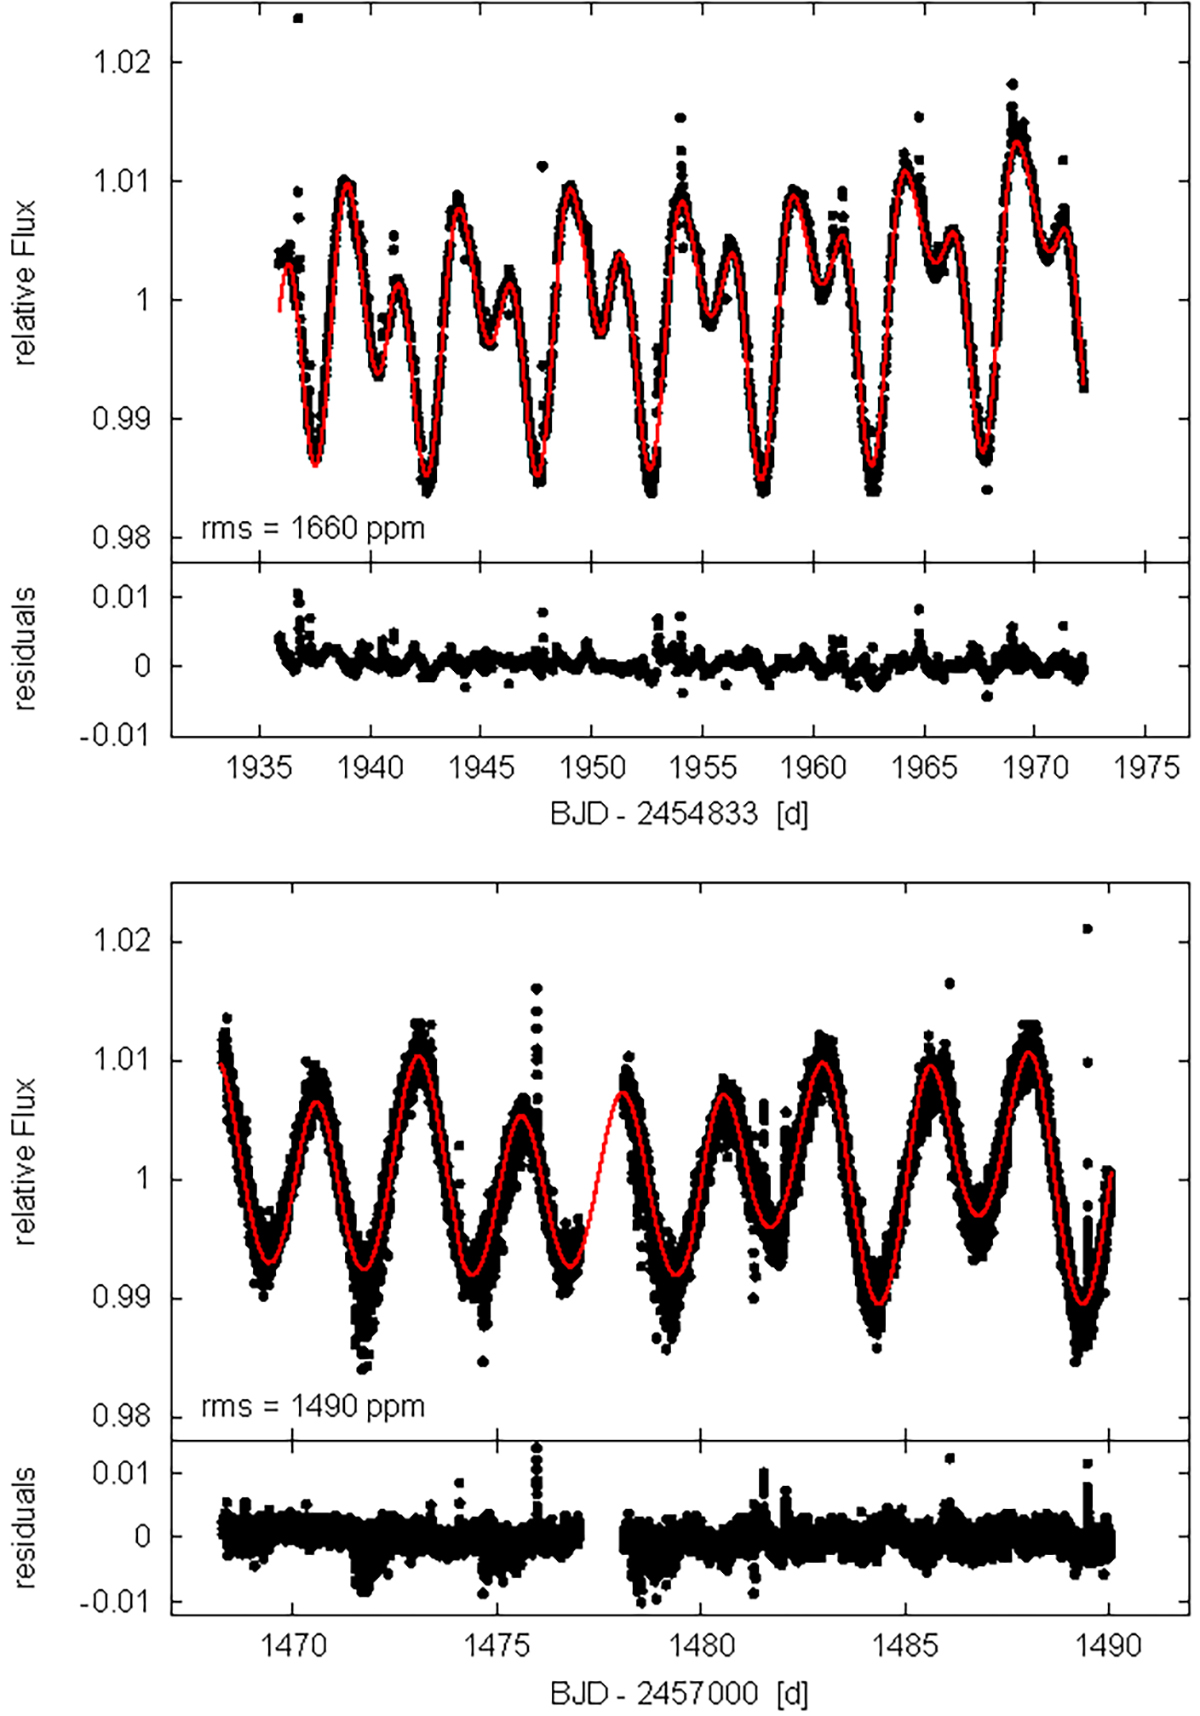
Fig. 6.
Download original image
K2 and TESS light curves with their spot model overplotted. The light curve was split into several parts (see Sect. 6.1.2) and a separate model was fitted to each of them. The model uses two dark spots of the same size. The stellar inclination (i = 90°), the spot temperature (Tspot = 3106 K), and the size of the spots were kept fixed for all models. Top: K2 light curve. A spot size of Rspot = 0.312 R* (↔ filling factor f = 0.049) was used in the model. Bottom: TESS light curve. Here a spot size of Rspot = 0.278 R* ( ↔ f = 0.039) was used.
Current usage metrics show cumulative count of Article Views (full-text article views including HTML views, PDF and ePub downloads, according to the available data) and Abstracts Views on Vision4Press platform.
Data correspond to usage on the plateform after 2015. The current usage metrics is available 48-96 hours after online publication and is updated daily on week days.
Initial download of the metrics may take a while.