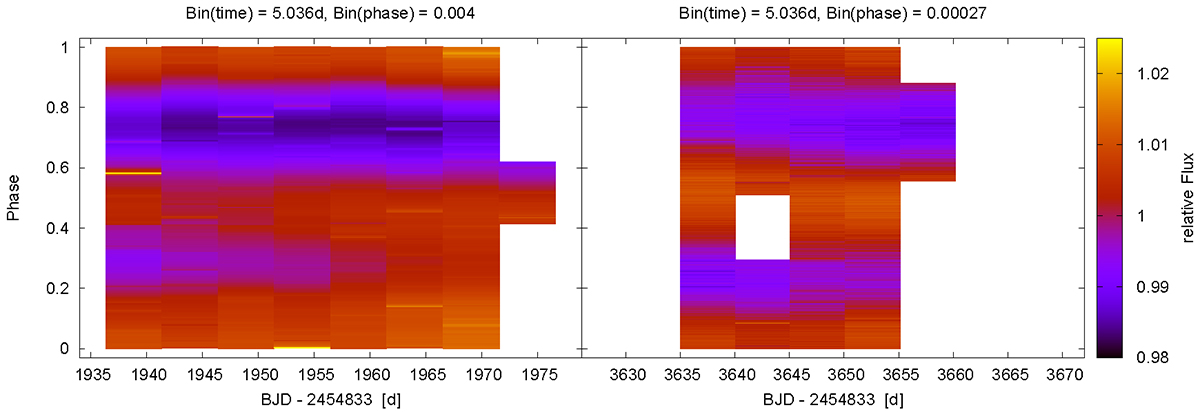
Fig. 4.
Download original image
Light curves of EPIC 202059229 in terms of phase over time with the relative flux as color code. Left: observations of K2. The light curve was split into the approximately seven rotation cycles present in the total light curve. Right: observations of TESS. The TESS data only consist of 4.5 rotation cycles. Both panels were plotted in the same time range and with the same color bar to show the light curves on the same scale. The size of the time bins is fixed on the rotation period determined from the K2 observation (Prot = 5.036 d). The difference in the size of the phase bins is caused by the different observing cadences.
Current usage metrics show cumulative count of Article Views (full-text article views including HTML views, PDF and ePub downloads, according to the available data) and Abstracts Views on Vision4Press platform.
Data correspond to usage on the plateform after 2015. The current usage metrics is available 48-96 hours after online publication and is updated daily on week days.
Initial download of the metrics may take a while.