Open Access
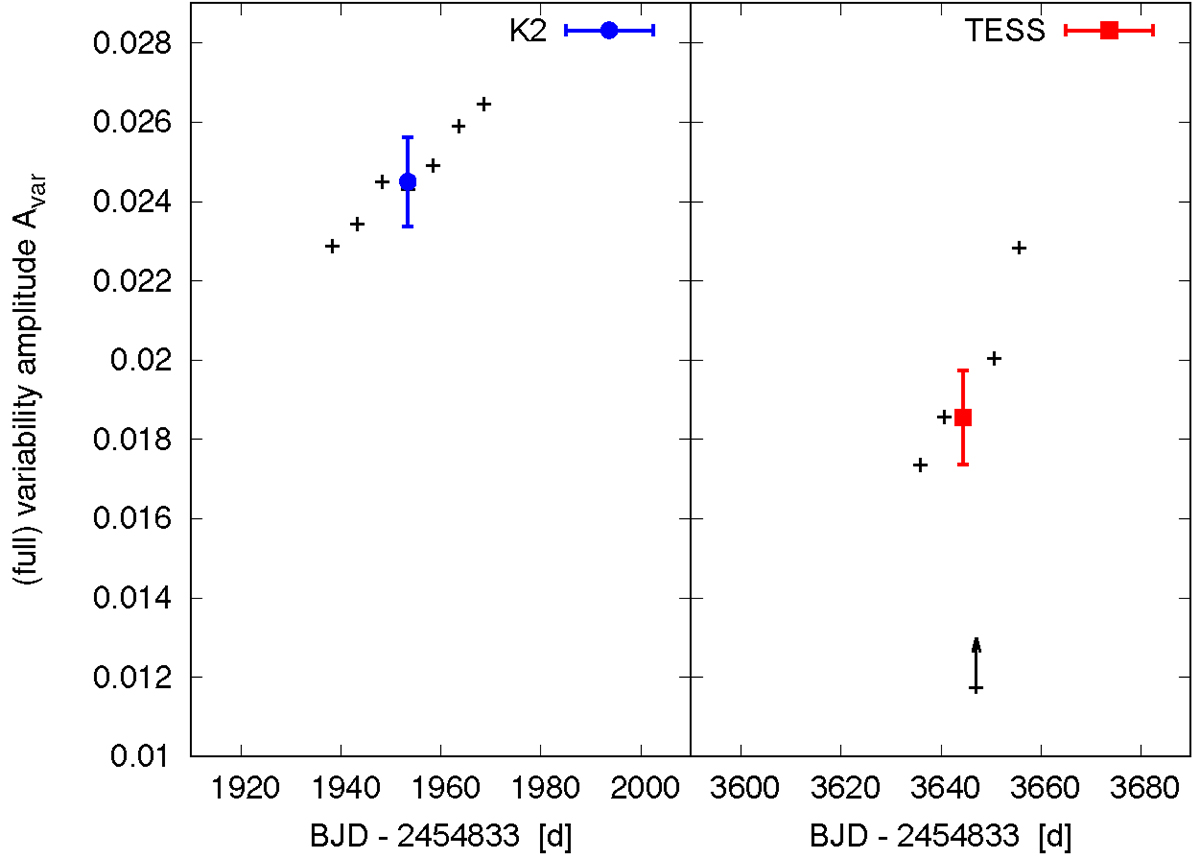
Fig. 3.
Download original image
Variability amplitudes measured in the K2 and TESS light curves of EPIC 202059229. The black arrow denotes the lower limit on the amplitude. The blue circle and the red square mark mean values ![]() that were used in the spot modeling.
that were used in the spot modeling.
Current usage metrics show cumulative count of Article Views (full-text article views including HTML views, PDF and ePub downloads, according to the available data) and Abstracts Views on Vision4Press platform.
Data correspond to usage on the plateform after 2015. The current usage metrics is available 48-96 hours after online publication and is updated daily on week days.
Initial download of the metrics may take a while.