Fig. A.1.
Download original image
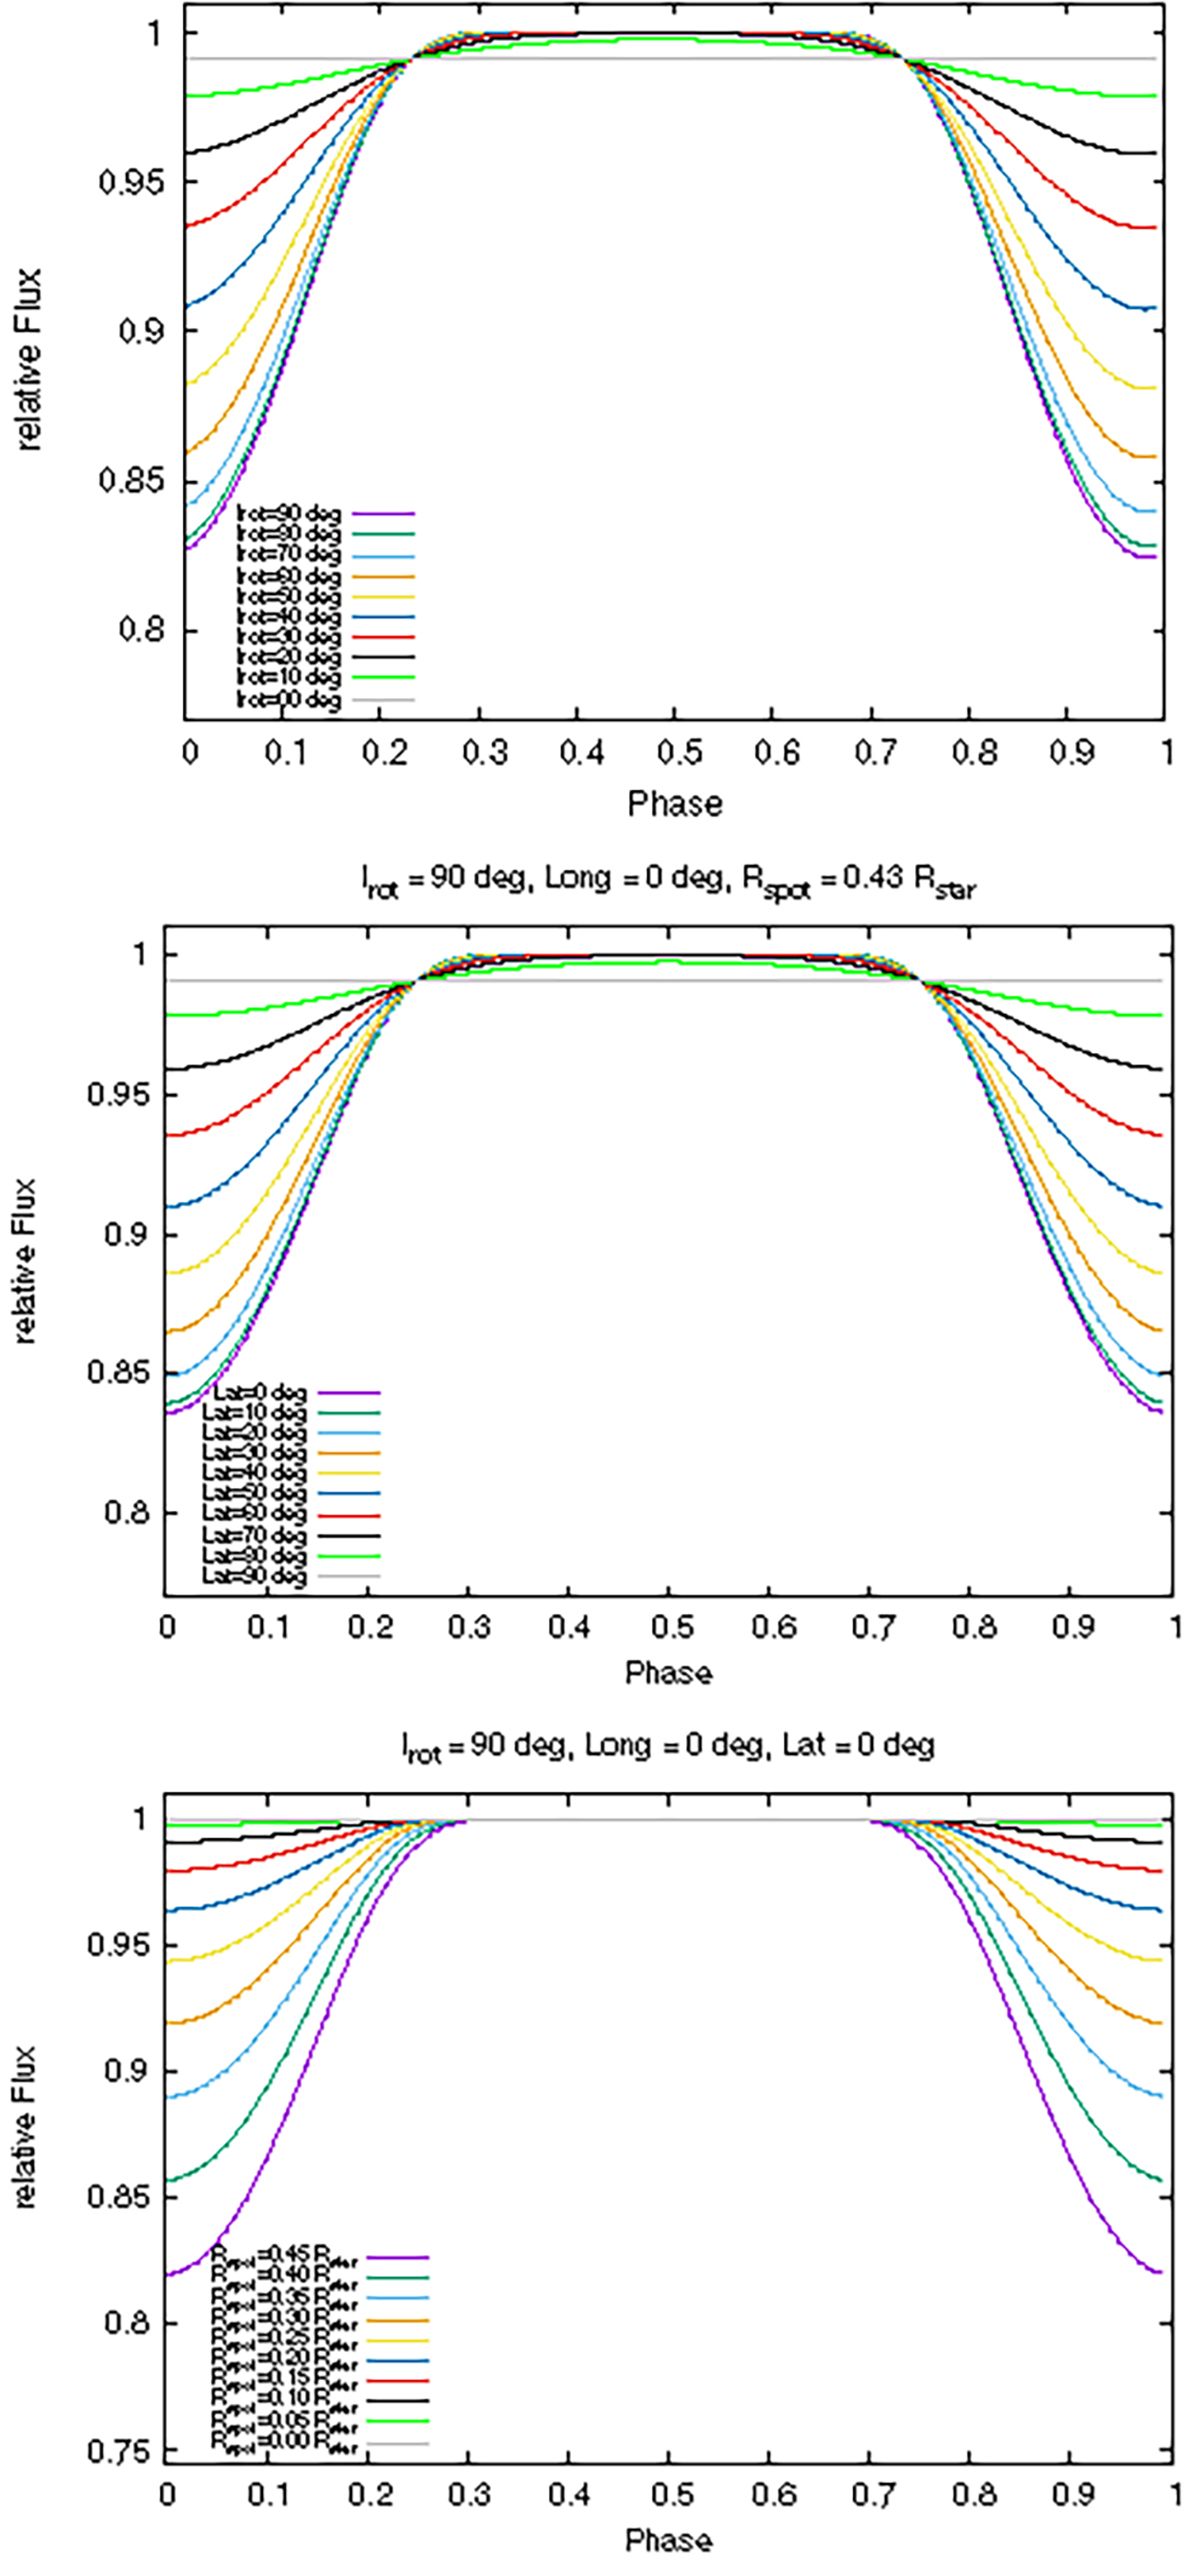
Visualization of the parameter degeneracy with the example of the TESS light curve of EPIC 245919787/TIC 434101713. Top: Models for one dark spot with a size of ![]() located at longitude = 0° and latitude = 0° for different values of the stellar inclination. Middle: Models for one dark spot with a size of
located at longitude = 0° and latitude = 0° for different values of the stellar inclination. Middle: Models for one dark spot with a size of ![]() located at longitude = 0° and stellar inclination=90° for different values of the latitude. Bottom: Models for one dark spot located at longitude=0° and latitude=0° with a stellar inclination of 90° for different values of the spot size.
located at longitude = 0° and stellar inclination=90° for different values of the latitude. Bottom: Models for one dark spot located at longitude=0° and latitude=0° with a stellar inclination of 90° for different values of the spot size.
Current usage metrics show cumulative count of Article Views (full-text article views including HTML views, PDF and ePub downloads, according to the available data) and Abstracts Views on Vision4Press platform.
Data correspond to usage on the plateform after 2015. The current usage metrics is available 48-96 hours after online publication and is updated daily on week days.
Initial download of the metrics may take a while.