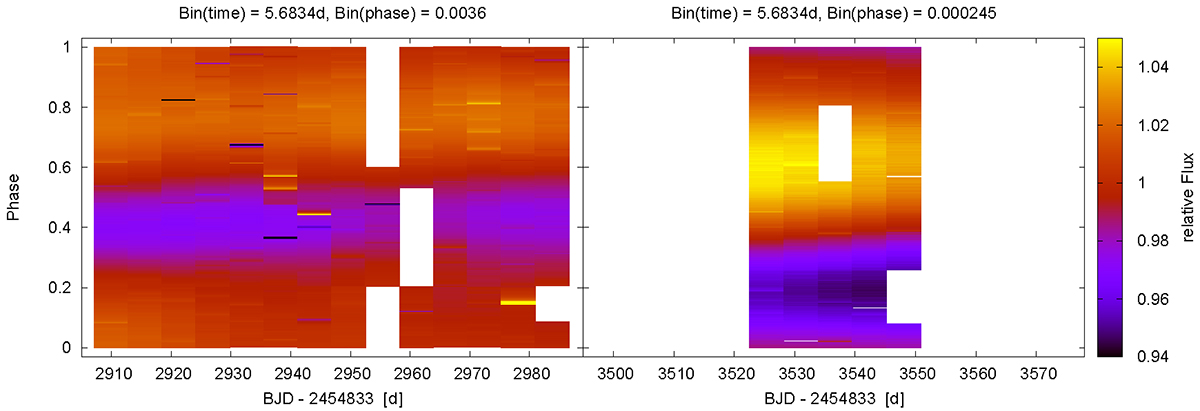
Fig. 12.
Download original image
Same as Fig. 4 but for EPIC 245919787. Left: observations of K2. The light curve was splitted into the ∼14 rotation cycles present in the total light curve. Right: observations of TESS. The TESS data only consists of five rotation cycles. Both panels were plotted in the same time range and the same color bar to show the light curves in the same scale. A phase shift of the TESS observations and an increased variability amplitude is clearly visible.
Current usage metrics show cumulative count of Article Views (full-text article views including HTML views, PDF and ePub downloads, according to the available data) and Abstracts Views on Vision4Press platform.
Data correspond to usage on the plateform after 2015. The current usage metrics is available 48-96 hours after online publication and is updated daily on week days.
Initial download of the metrics may take a while.