Open Access
Fig. 11.
Download original image
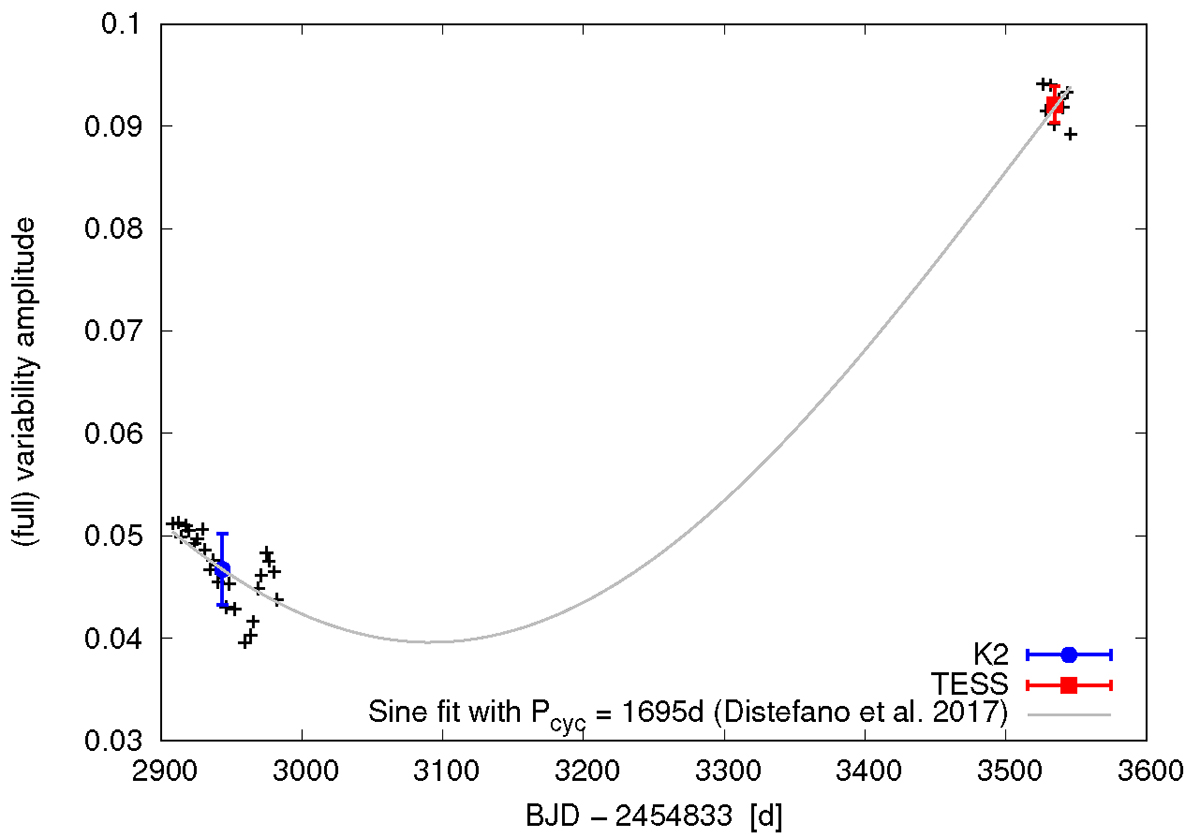
Variability amplitude for the individual rotation cycles in the K2 and TESS light curves of EPIC 245919787. The blue circle and the red square mark the ![]() values that we then used in the spot modeling. The best fitting sine function with the cycle period found by Distefano et al. (2017) in ASAS data is also shown.
values that we then used in the spot modeling. The best fitting sine function with the cycle period found by Distefano et al. (2017) in ASAS data is also shown.
Current usage metrics show cumulative count of Article Views (full-text article views including HTML views, PDF and ePub downloads, according to the available data) and Abstracts Views on Vision4Press platform.
Data correspond to usage on the plateform after 2015. The current usage metrics is available 48-96 hours after online publication and is updated daily on week days.
Initial download of the metrics may take a while.