Fig. 1.
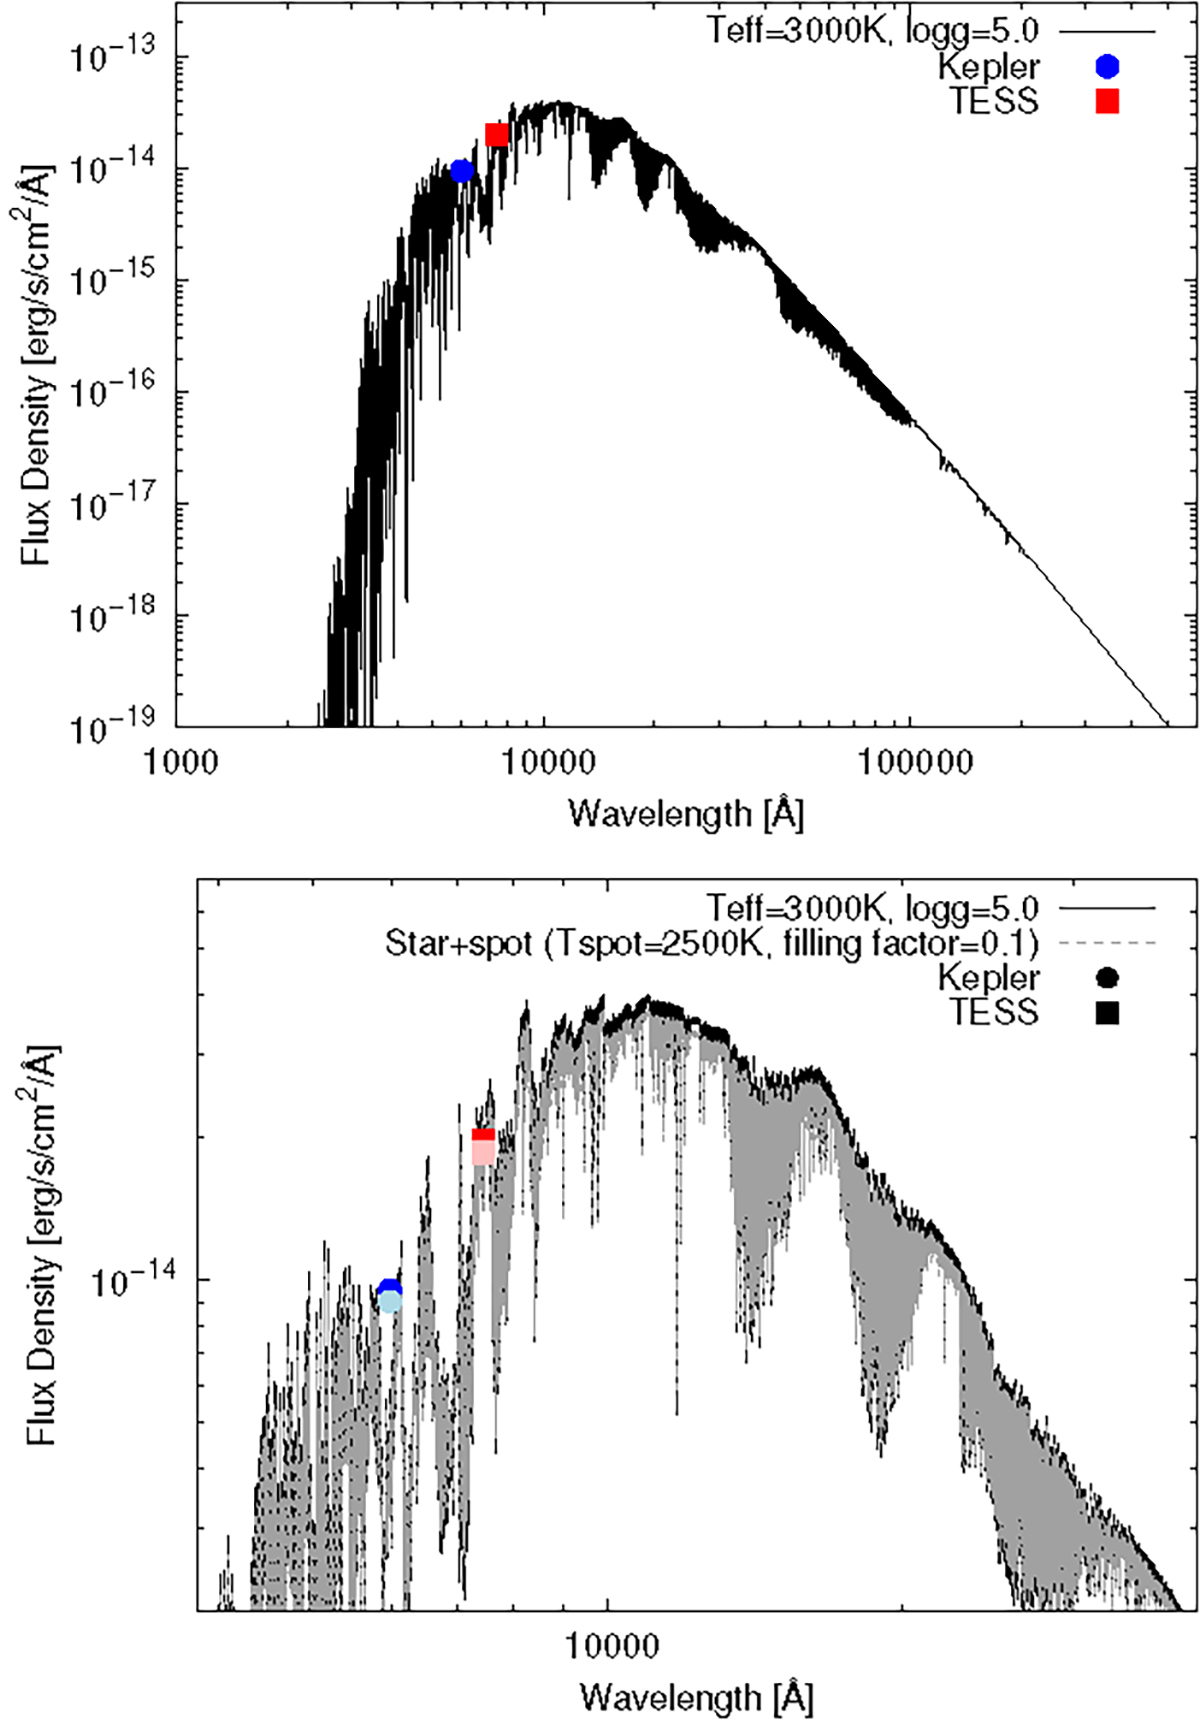
Download original image
Example spectra for a fictitious star (Teff = 3000 K, log g = 5.0, R* = 0.20 R⊙, distance = 14 pc). Top: spectrum of the spotless photosphere. The blue circle and the red square mark the fluxes in the K2 and TESS wavelength band, respectively. Bottom: zoom onto the spectrum. The spectrum of the spotted photosphere is overplotted as a dashed gray line. The parameters of the spot are Tspot = 2500 K and f = 0.1. The fluxes in the K2 and TESS wavelength band, which includes the star spot, are shown as the light blue square and pink circle, respectively. The resulting, spot modulation amplitudes in the light curve are 5.96% for K2 and 6.73% for TESS.
Current usage metrics show cumulative count of Article Views (full-text article views including HTML views, PDF and ePub downloads, according to the available data) and Abstracts Views on Vision4Press platform.
Data correspond to usage on the plateform after 2015. The current usage metrics is available 48-96 hours after online publication and is updated daily on week days.
Initial download of the metrics may take a while.