Open Access
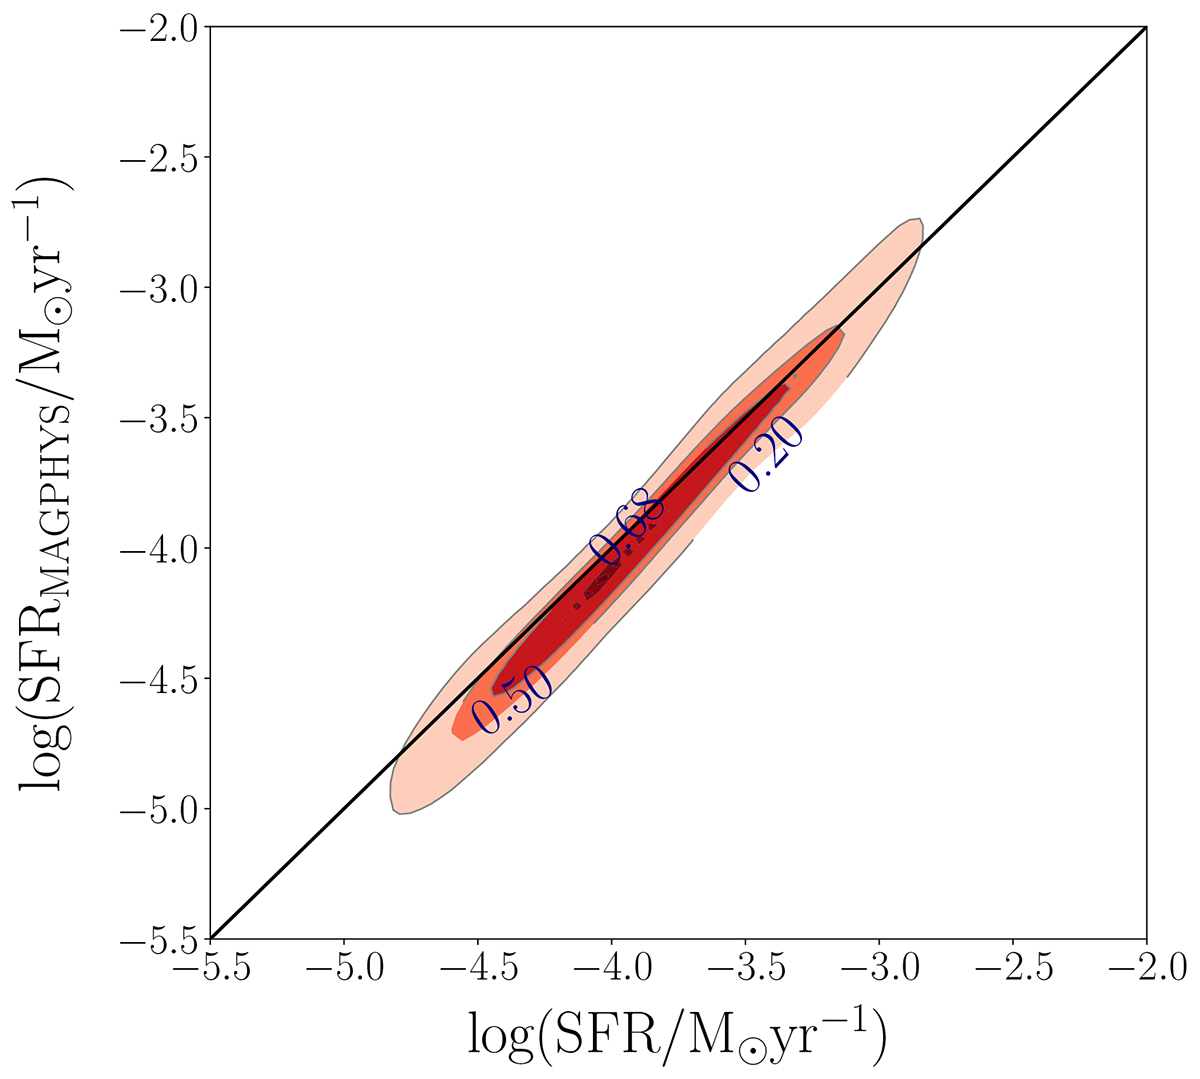
Fig. A.1.
Download original image
Comparison between the SFR values obtained from magphys (y-axis) and the ones used in this work (x-axis), derived as the sum of SFRUV (Eq. 1) and SFRIR (Eq. 2). The red-scale contours are related to the distribution of points and three density levels are highlighted. The 1:1 relation is represented by the black solid line.
Current usage metrics show cumulative count of Article Views (full-text article views including HTML views, PDF and ePub downloads, according to the available data) and Abstracts Views on Vision4Press platform.
Data correspond to usage on the plateform after 2015. The current usage metrics is available 48-96 hours after online publication and is updated daily on week days.
Initial download of the metrics may take a while.