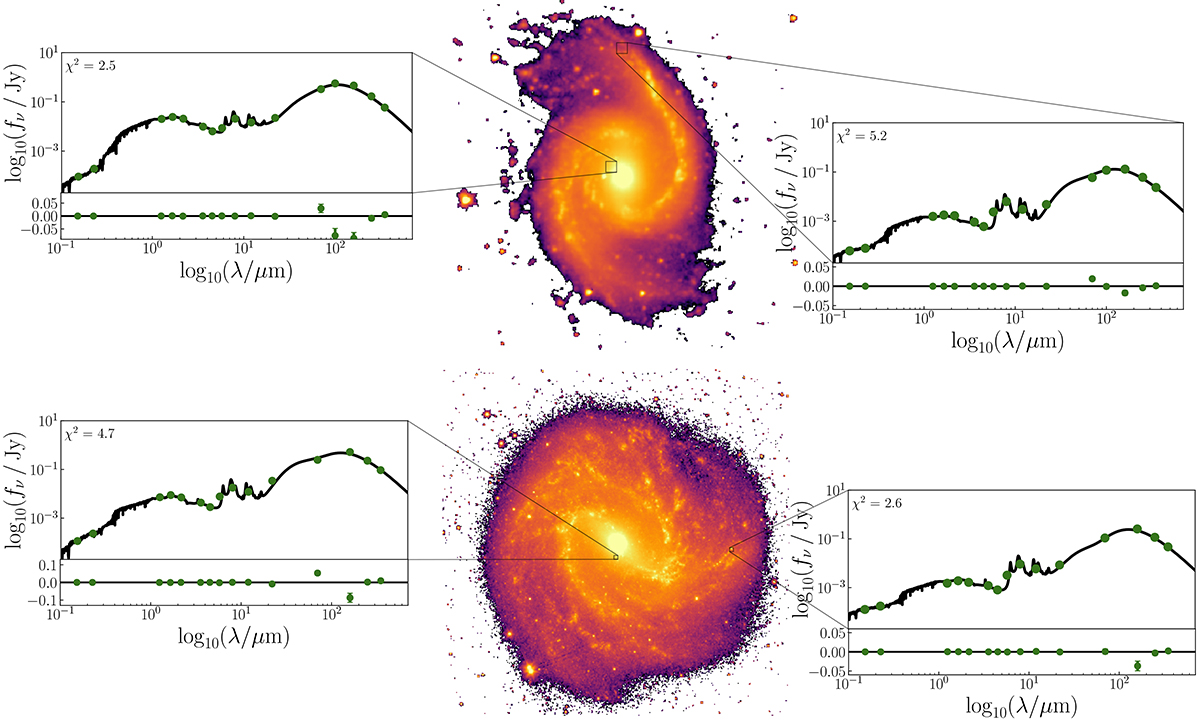
Fig. 5.
Download original image
Output of the magphys SED fitting performed in one of the central pixels and in one of the outermost pixels of NGC 1566 (upper panels) and of NGC 5236 (bottom panels). The green data points are the observed fluxes in the available bands and the χ2 of the fit (black line) is reported in the upper left corner of the plots. At the bottom of each subfigure, we also display the difference in dex between the observations and the best-fitting model with the associated error bars; when not visible they are smaller than the corresponding markers.
Current usage metrics show cumulative count of Article Views (full-text article views including HTML views, PDF and ePub downloads, according to the available data) and Abstracts Views on Vision4Press platform.
Data correspond to usage on the plateform after 2015. The current usage metrics is available 48-96 hours after online publication and is updated daily on week days.
Initial download of the metrics may take a while.