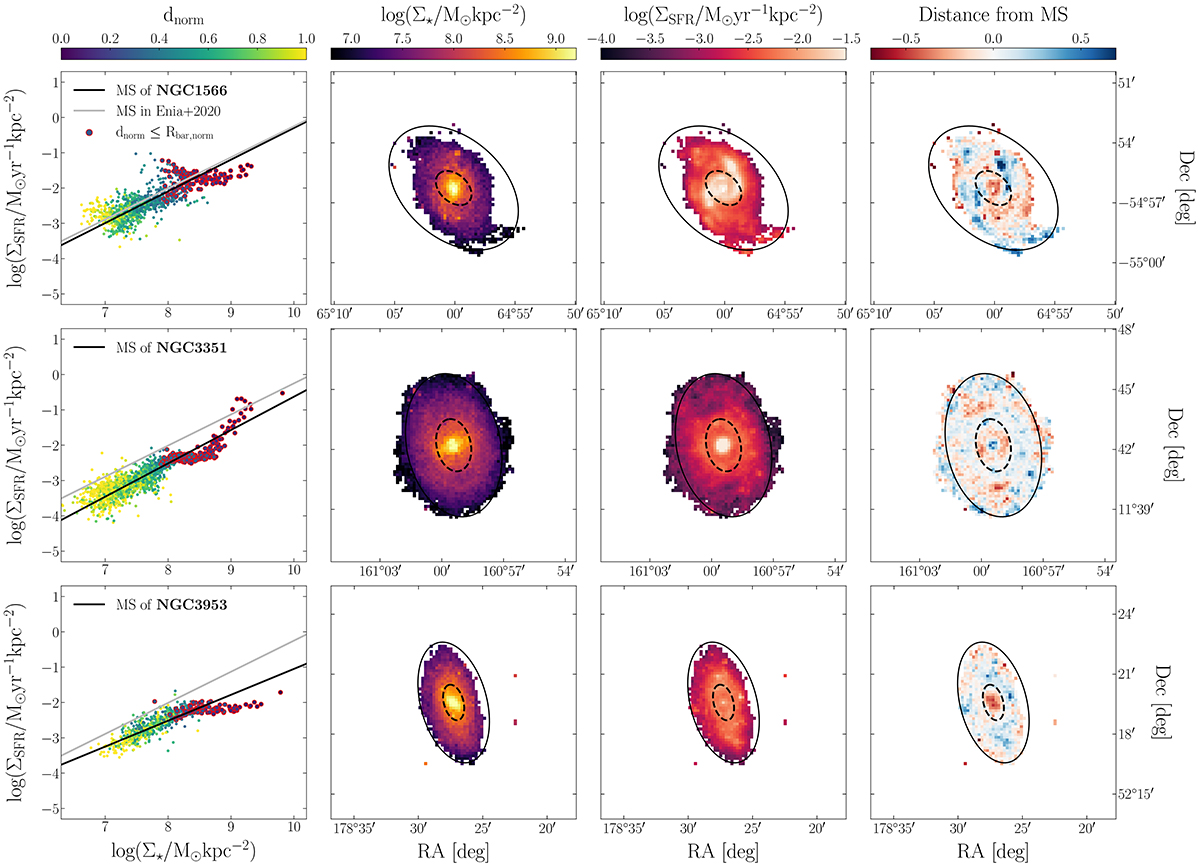
Fig. 2.
Download original image
Results for NGC 1566 (first row), NGC 3351 (second row), and NGC 3953 (third row). For each galaxy, from left to right, we show: (i) how the galaxy cells populate the log Σ⋆ – log ΣSFR plane with the corresponding best-fit MS (black line), as well as the MS found by Enia et al. (2020) for unbarred galaxies (grey line), where each point is colour coded according to the dnorm values and the ones sampling the bar-hosting region (dnorm ≤ Rbar, norm) are circled in red; (ii) the spatially resolved distribution of the stellar mass surface density; (iii) the spatially resolved distribution of the SFR surface density; and (iv) the map representing the distance of each cell from the best-fit MS. In the last three columns, we display the 25th level isophote of semi-major axis equal to R25 with a solid black line and the rescaled ellipse enclosing the bar with a dashed black line.
Current usage metrics show cumulative count of Article Views (full-text article views including HTML views, PDF and ePub downloads, according to the available data) and Abstracts Views on Vision4Press platform.
Data correspond to usage on the plateform after 2015. The current usage metrics is available 48-96 hours after online publication and is updated daily on week days.
Initial download of the metrics may take a while.