Open Access
Fig. 1
Download original image
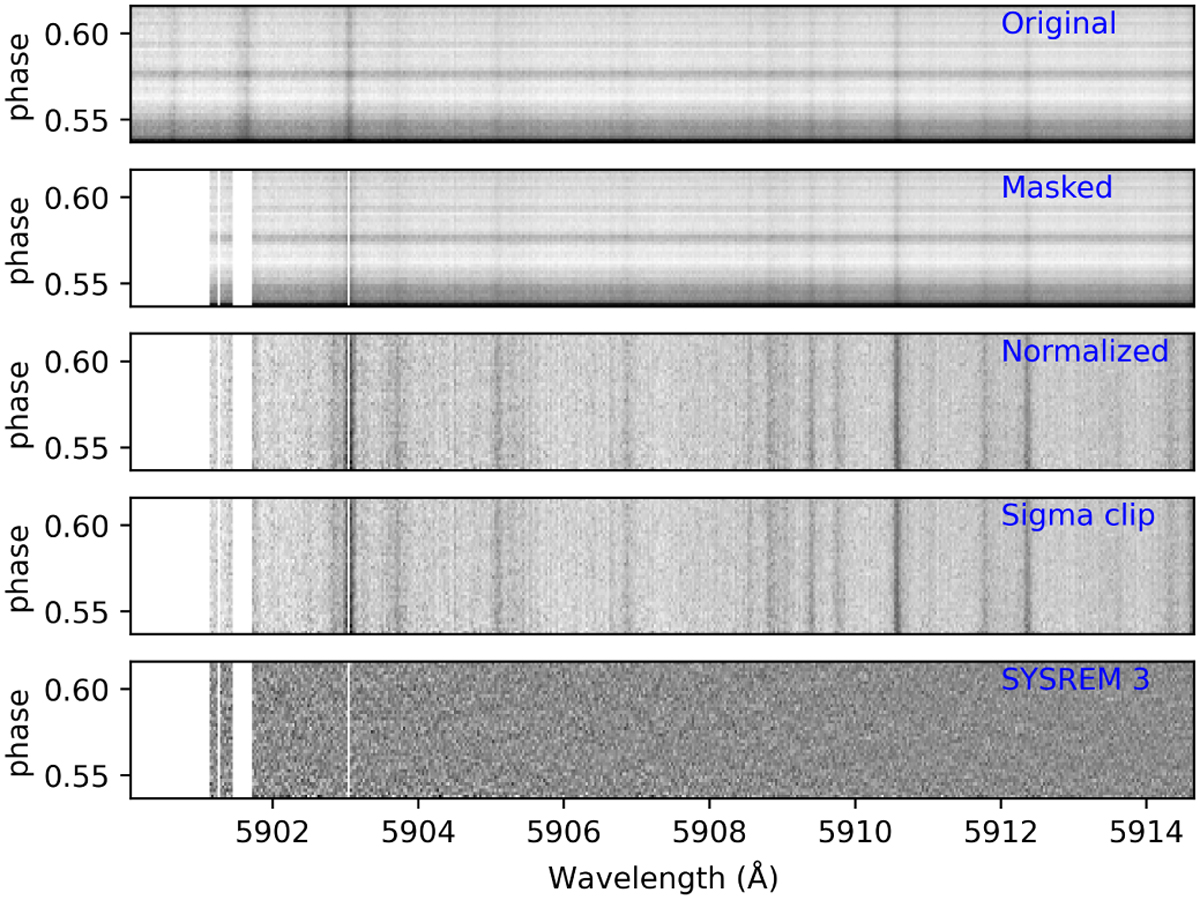
Example of the data reduction procedure. These are spectra from the second night. The original spectrum, masked spectrum, normalized spectrum, spectrum after the 5σ clip, and spectrum after the third SYSREM iteration are presented from top to bottom, respectively.
Current usage metrics show cumulative count of Article Views (full-text article views including HTML views, PDF and ePub downloads, according to the available data) and Abstracts Views on Vision4Press platform.
Data correspond to usage on the plateform after 2015. The current usage metrics is available 48-96 hours after online publication and is updated daily on week days.
Initial download of the metrics may take a while.