Fig. 8.
Download original image
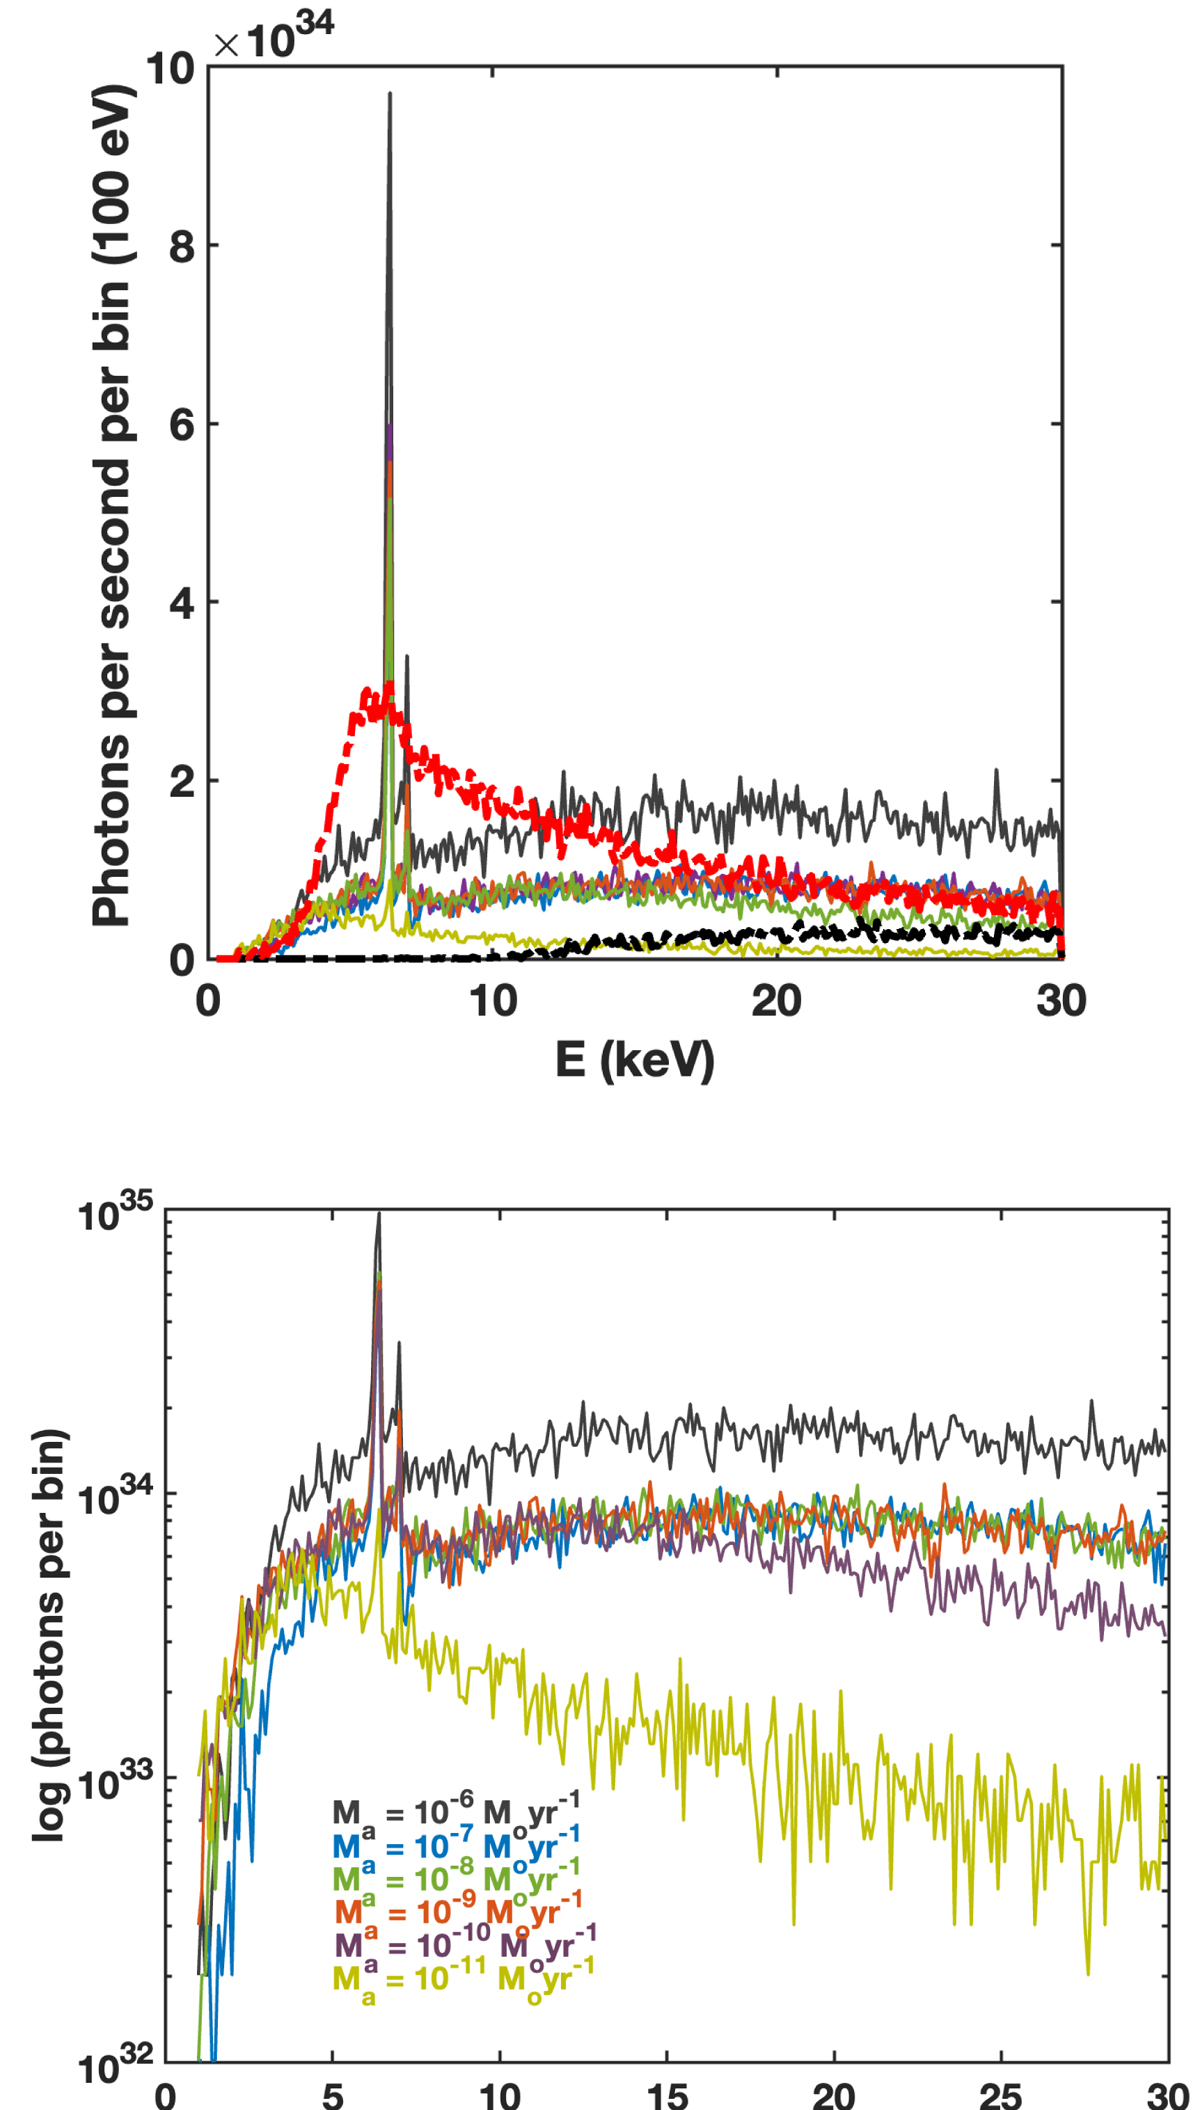
Output X-ray spectrum of the hot spot. Top panel: comparison between the X-ray spectra of the hot spot (thin lines) with the transmitted spectra (thick dashed lines; see Fig. 7). All the spectra are plotted on the same scale. The Fe feature in the backscattered spectrum at high accretion rates is strong. Bottom panel: X-ray spectra of the hot spot on a logarithmic scale. The e-beam properties are K = 800 keV and 2 × 10⁻³ L⊙.
Current usage metrics show cumulative count of Article Views (full-text article views including HTML views, PDF and ePub downloads, according to the available data) and Abstracts Views on Vision4Press platform.
Data correspond to usage on the plateform after 2015. The current usage metrics is available 48-96 hours after online publication and is updated daily on week days.
Initial download of the metrics may take a while.