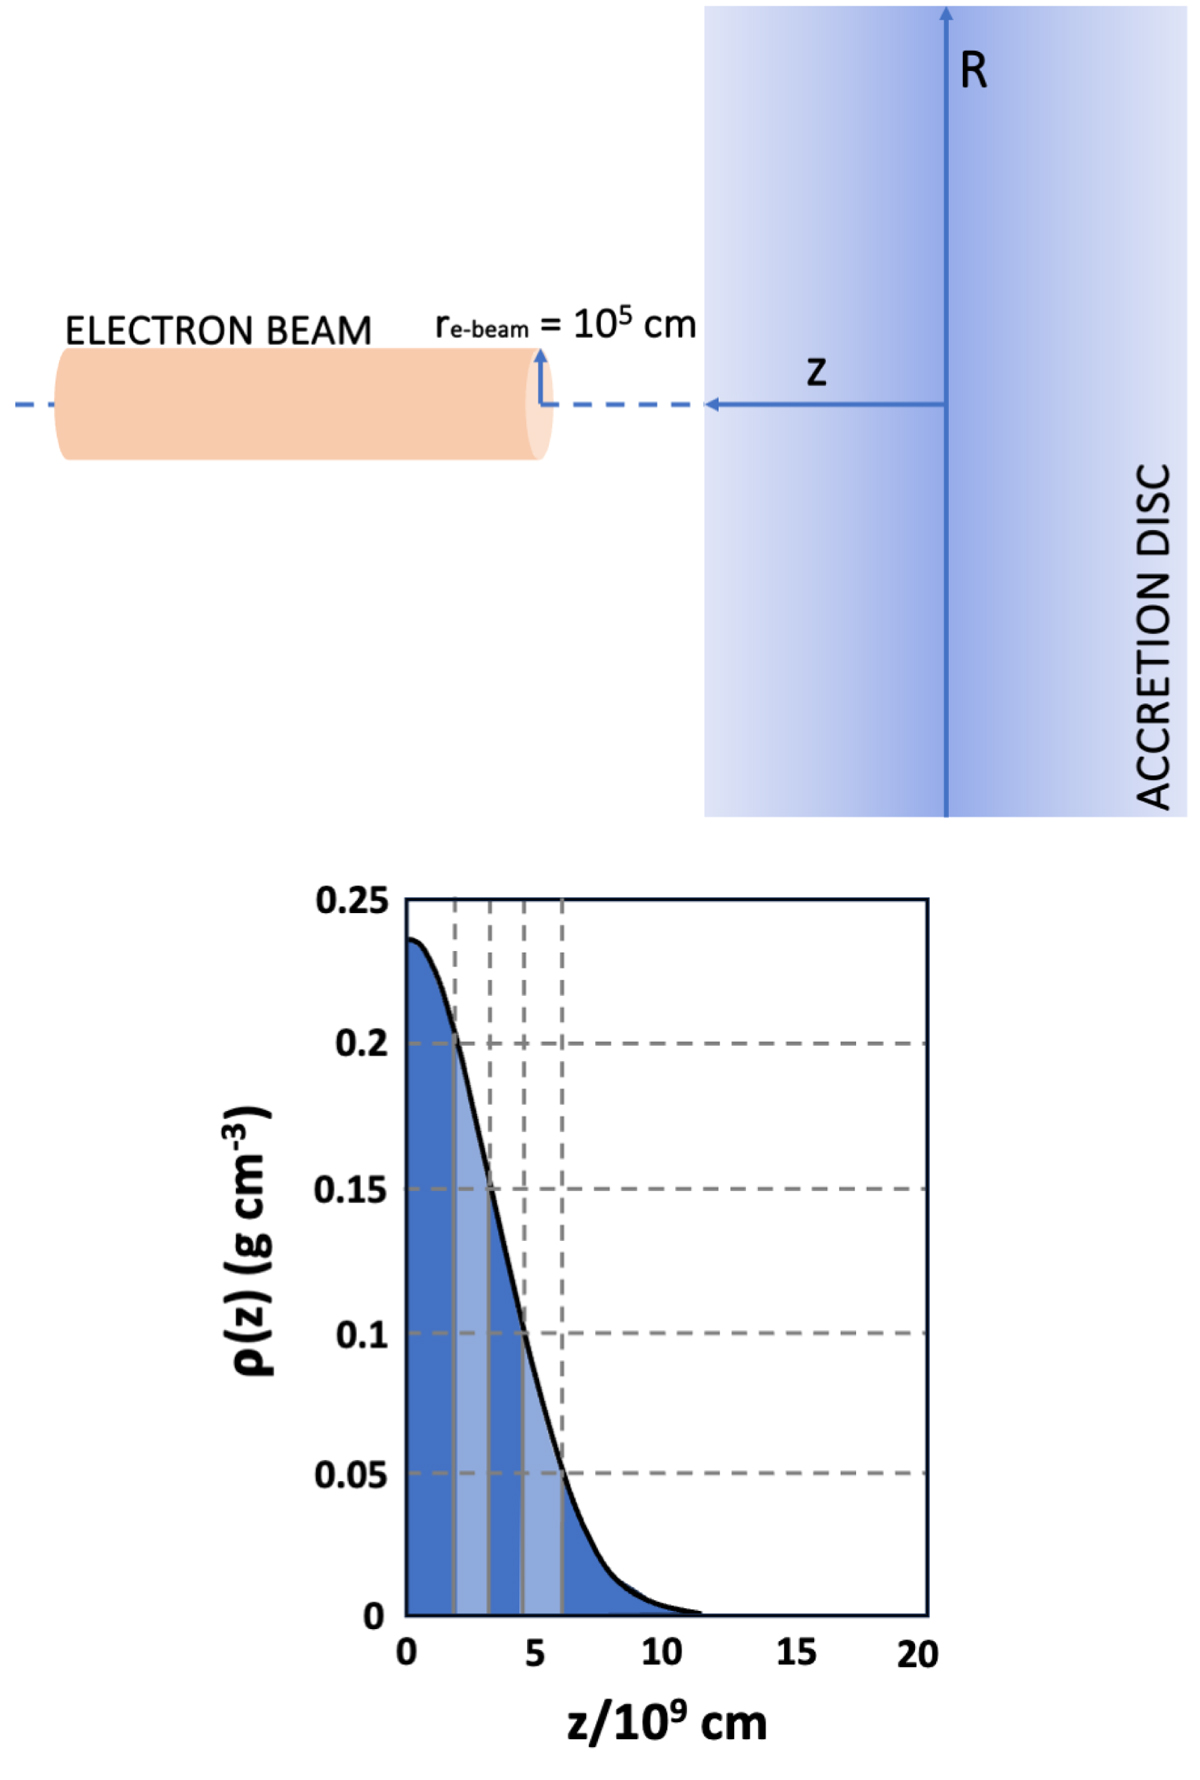
Fig. 6.
Download original image
Top: Simulation scheme. The e-beam impinges normally on the accretion disk surface. Bottom: Normalized density profile (see Eq. (6)) represented for the inner border of a sample disk with an accretion rate of 10−8 M⊙ yr−1. The structure is symmetric around the disk midplane, and only the upper part is represented. The density profile from Eq. (6) is plotted with a blue line, and the limits of the five layers implemented in the simulation are marked with dashed lines.
Current usage metrics show cumulative count of Article Views (full-text article views including HTML views, PDF and ePub downloads, according to the available data) and Abstracts Views on Vision4Press platform.
Data correspond to usage on the plateform after 2015. The current usage metrics is available 48-96 hours after online publication and is updated daily on week days.
Initial download of the metrics may take a while.