Open Access
Fig. 4.
Download original image
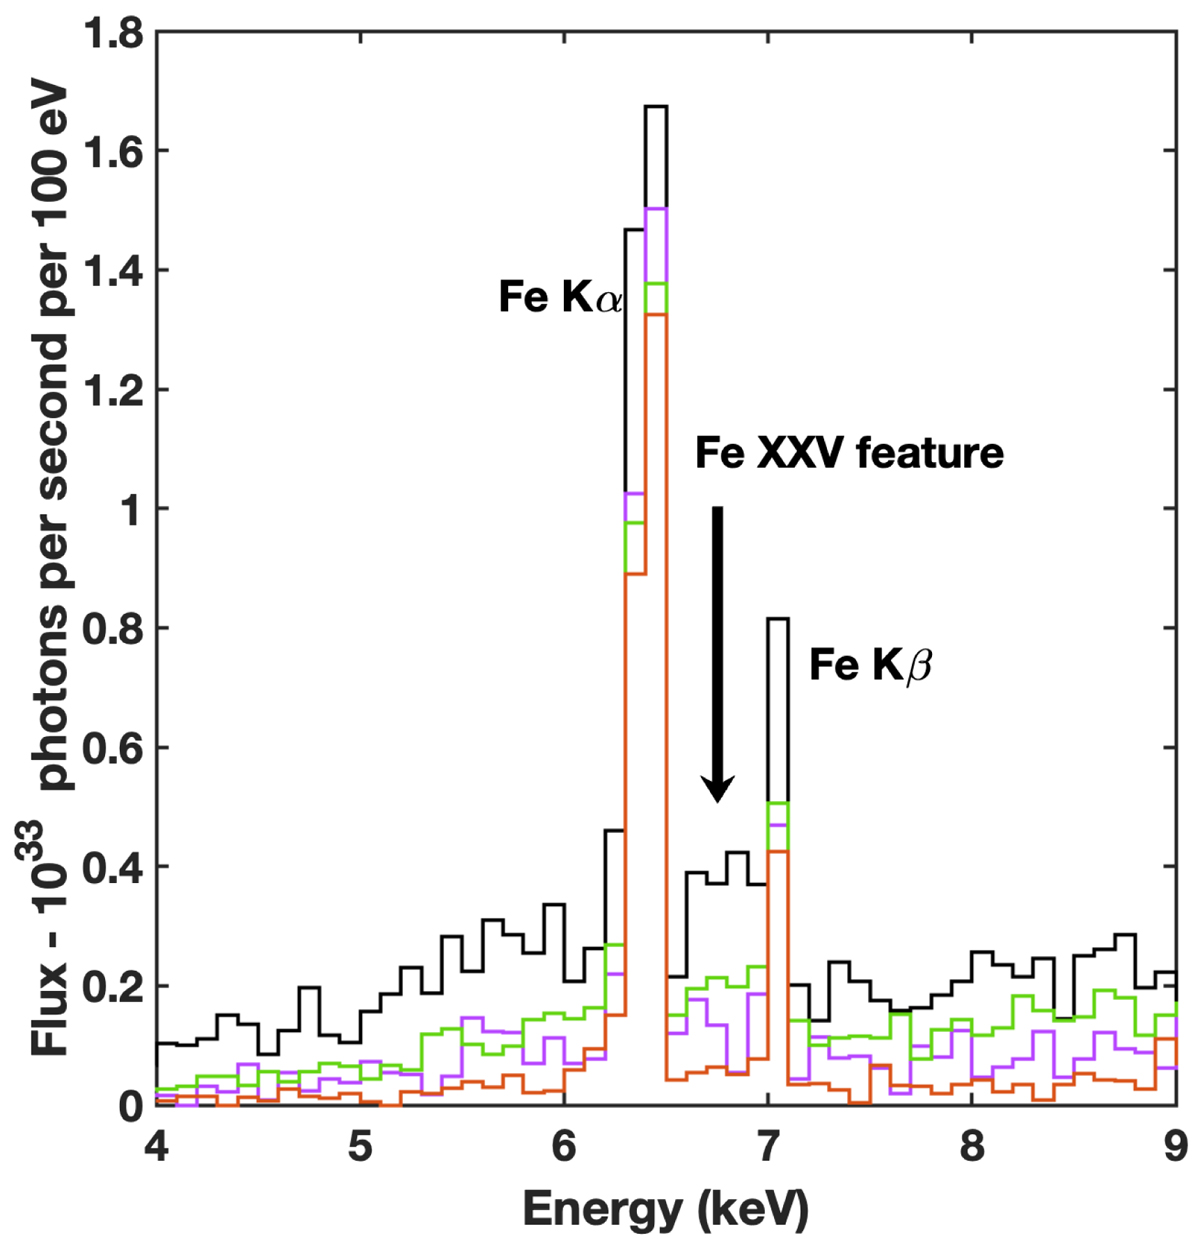
Fe feature in the spectrum of the hot spot (see Fig. 3). Only some relevant simulations are shown. (ρ = 1016 cm s−3, K = 800 keV) is marked in black, (ρ = 1017 cm s−3, K = 800 keV) is marked in purple, (ρ = 1016 cm s−3, K = 1, 600 keV) is marked in green, and (ρ = 1017 cm s−3, K = 1600 keV) is marked in brown.
Current usage metrics show cumulative count of Article Views (full-text article views including HTML views, PDF and ePub downloads, according to the available data) and Abstracts Views on Vision4Press platform.
Data correspond to usage on the plateform after 2015. The current usage metrics is available 48-96 hours after online publication and is updated daily on week days.
Initial download of the metrics may take a while.