Fig. 12.
Download original image
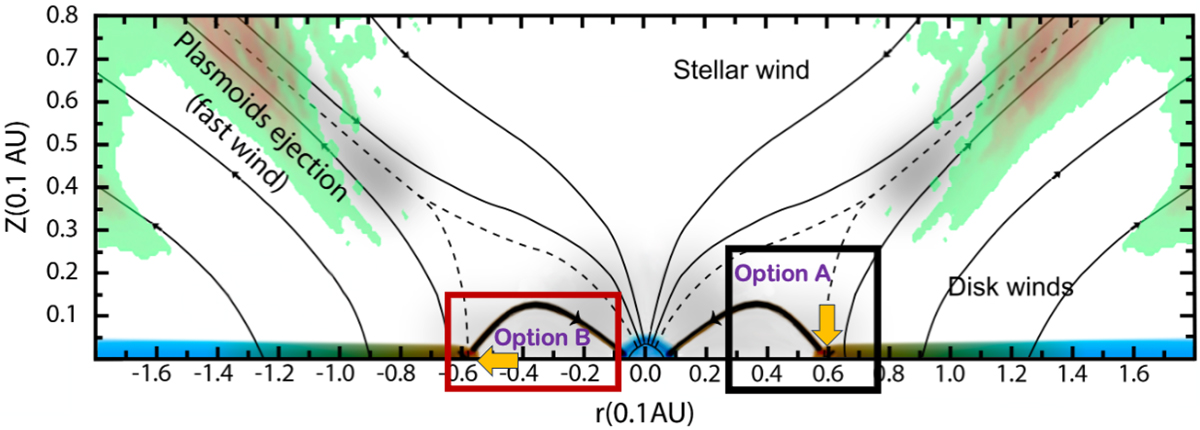
Map of the C III] (191 nm) emissivity caused by the star-disk interaction from MHD simulations of the disk-star interaction (Gómez de Castro & von Rekowski 2011). At the top, we plot the main components of the TTSs environment and the magnetic structure. The magnetic field is represented by solid lines, and the very thick line marks the connection between the star and the inner border of the disk. The stellar interaction with the infalling magnetized plasma drives the outflow and generates reconnection layers (dashed lines).
Current usage metrics show cumulative count of Article Views (full-text article views including HTML views, PDF and ePub downloads, according to the available data) and Abstracts Views on Vision4Press platform.
Data correspond to usage on the plateform after 2015. The current usage metrics is available 48-96 hours after online publication and is updated daily on week days.
Initial download of the metrics may take a while.