Open Access
Fig. 11.
Download original image
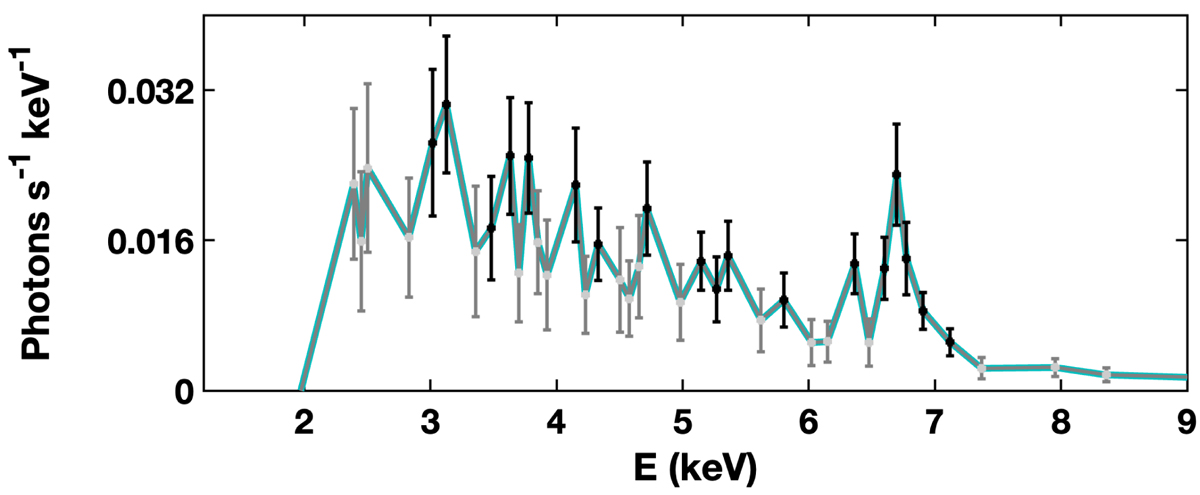
Spectral distribution of the X-ray radiation produced by the flare. Data points with S/N ≥ 3 are marked in black, and those with S/N ≥ 2 are shown in gray. The green line is plotted to guide the eye to the overall energy distribution, where the prominent Fe Kα and Fe XXV features are readily recognized.
Current usage metrics show cumulative count of Article Views (full-text article views including HTML views, PDF and ePub downloads, according to the available data) and Abstracts Views on Vision4Press platform.
Data correspond to usage on the plateform after 2015. The current usage metrics is available 48-96 hours after online publication and is updated daily on week days.
Initial download of the metrics may take a while.