Fig. 4
Download original image
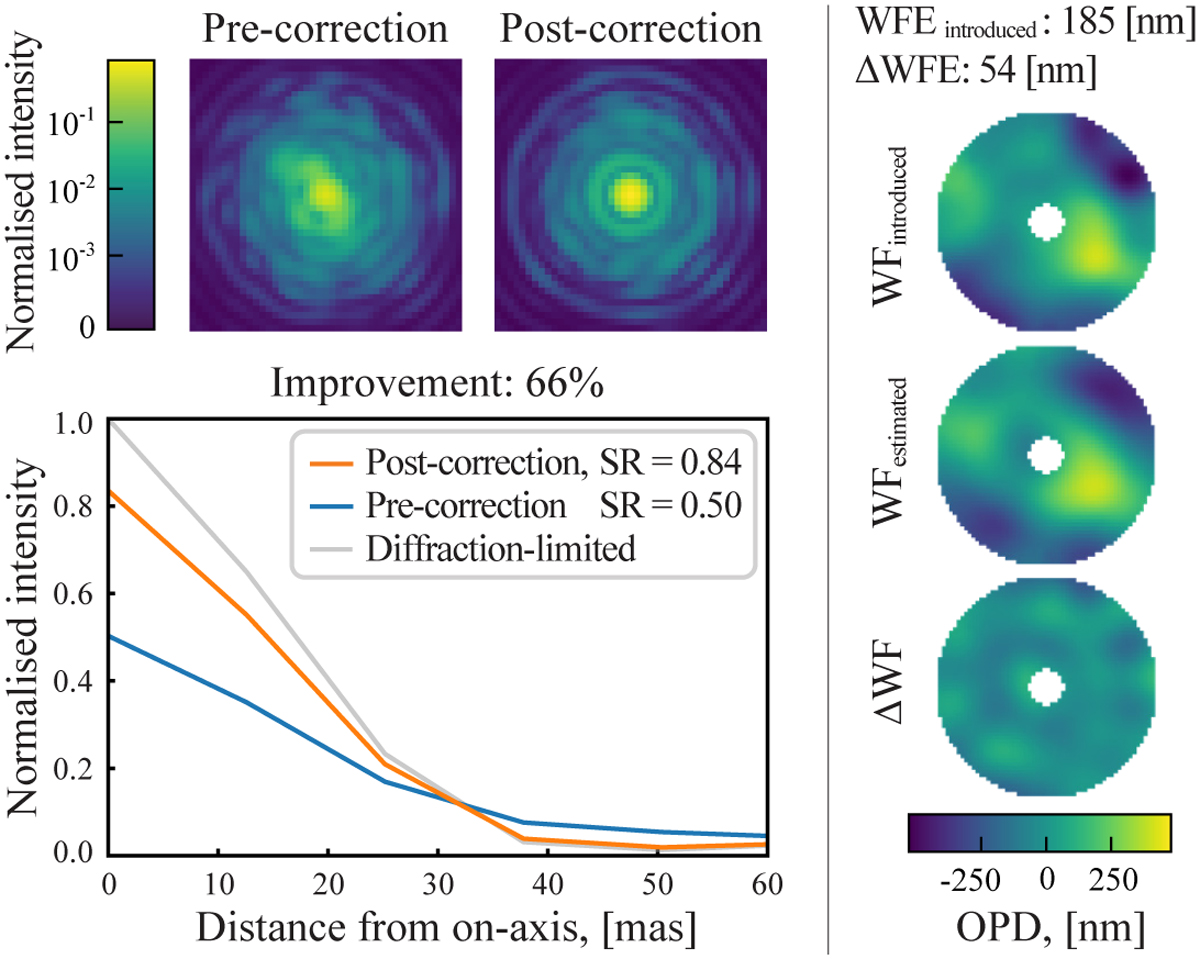
Averaged PSF cubes simulated with (post-correction) and without (pre-correction) compensating for the NCPAs (see left column, top row). The improvement observed in the “post-correction” case indicates the successful retrieval of the quasi-static phase component associated with NCPAs. The right column demonstrates the corresponding wavefronts and their difference. See Eq. (9) for notation details. Simulated with λ = 1600 nm.
Current usage metrics show cumulative count of Article Views (full-text article views including HTML views, PDF and ePub downloads, according to the available data) and Abstracts Views on Vision4Press platform.
Data correspond to usage on the plateform after 2015. The current usage metrics is available 48-96 hours after online publication and is updated daily on week days.
Initial download of the metrics may take a while.