Open Access
Fig. A.1
Download original image
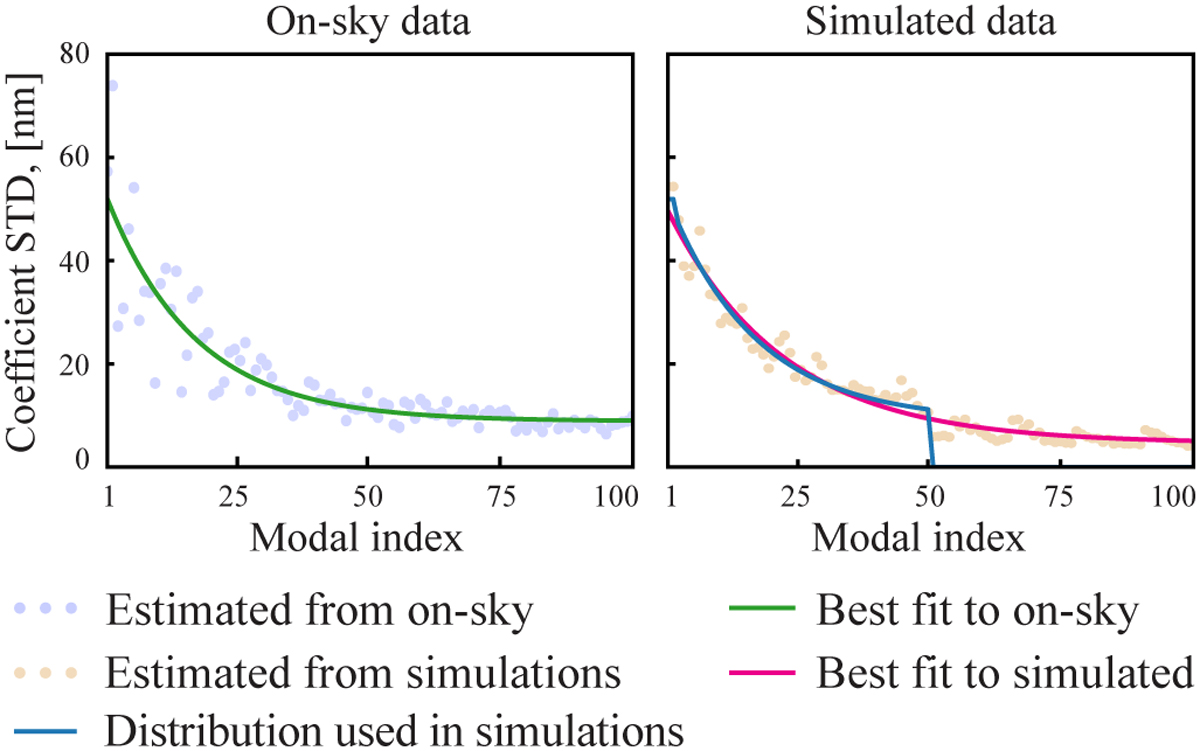
Standard deviation of the LO coefficients obtained using on-sky PSFs (left) and realistically simulated PSFs (right). The synthetic PSFs were generated using the LO distribution law (blue line), derived from the distribution previously estimated from on-sky data (green line).
Current usage metrics show cumulative count of Article Views (full-text article views including HTML views, PDF and ePub downloads, according to the available data) and Abstracts Views on Vision4Press platform.
Data correspond to usage on the plateform after 2015. The current usage metrics is available 48-96 hours after online publication and is updated daily on week days.
Initial download of the metrics may take a while.