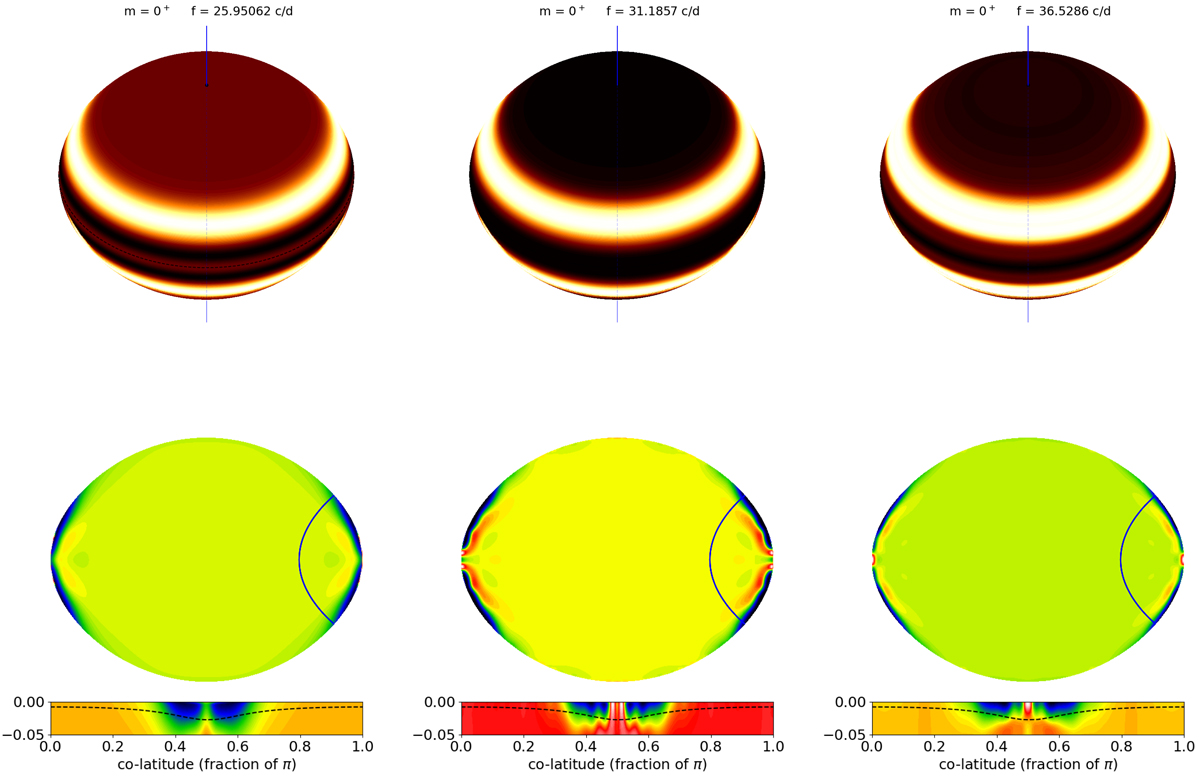
Fig. 8.
Download original image
Three 0+ modes identified in the spectrum of Altair. The top row shows the surface amplitude of the relative pressure fluctuation associated with the mode as seen from the Earth. The bottom row shows a meridional cut of the same quantity along with a zoom of the subsurface layers, with the depth being limited to 5% of the equatorial radius. The solid line in the meridional cut of the star shows the trajectory of an acoustic ray associated with the mode. The dashed black line in the zoomed layers highlights the 50 000 K isotherm around which the second ionisation of helium takes place.
Current usage metrics show cumulative count of Article Views (full-text article views including HTML views, PDF and ePub downloads, according to the available data) and Abstracts Views on Vision4Press platform.
Data correspond to usage on the plateform after 2015. The current usage metrics is available 48-96 hours after online publication and is updated daily on week days.
Initial download of the metrics may take a while.