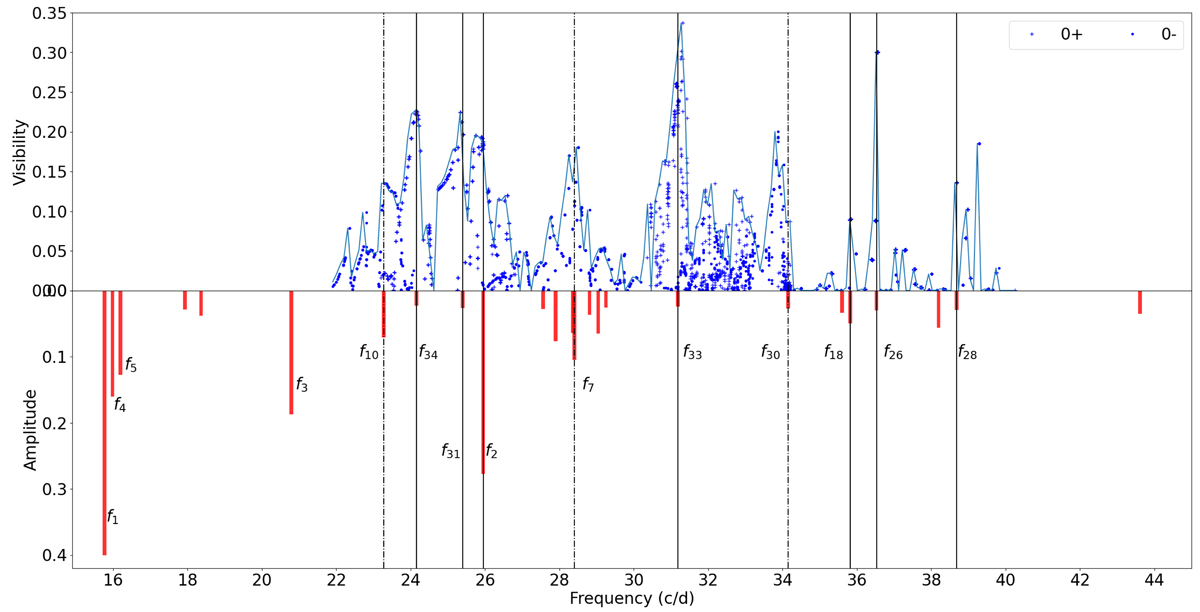
Fig. 7.
Download original image
Same as Fig. 5 but only axisymmetric modes have been computed and plotted. Dashed-dotted vertical lines mark 0− modes, while vertical solid lines highlight 0+ modes. The core hydrogen mass fraction has been slightly increased to Xcore/Xenv = 0.972 to show the matching between modelled frequencies with high visibilities and observed frequencies.
Current usage metrics show cumulative count of Article Views (full-text article views including HTML views, PDF and ePub downloads, according to the available data) and Abstracts Views on Vision4Press platform.
Data correspond to usage on the plateform after 2015. The current usage metrics is available 48-96 hours after online publication and is updated daily on week days.
Initial download of the metrics may take a while.