Fig. 6.
Download original image
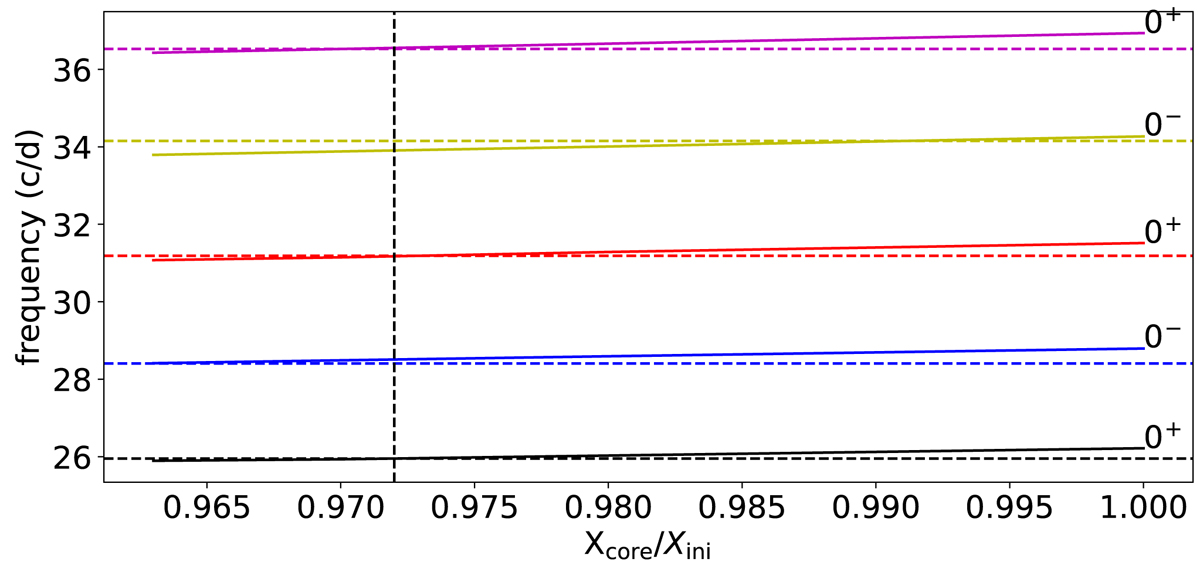
Variation of the frequencies of five axisymmetric island modes (solid lines) as a function of the hydrogen mass fraction in the core with respect to that of the envelope. Here, Xenv = Xini = 0.739, as in Bouchaud et al. (2020). The horizontal dashed lines show the observed frequencies, while the vertical dashed line points out Xc = 0.972, which is the value where the frequencies of three 0+ modes of the model match the observed ones.
Current usage metrics show cumulative count of Article Views (full-text article views including HTML views, PDF and ePub downloads, according to the available data) and Abstracts Views on Vision4Press platform.
Data correspond to usage on the plateform after 2015. The current usage metrics is available 48-96 hours after online publication and is updated daily on week days.
Initial download of the metrics may take a while.