Fig. 5.
Download original image
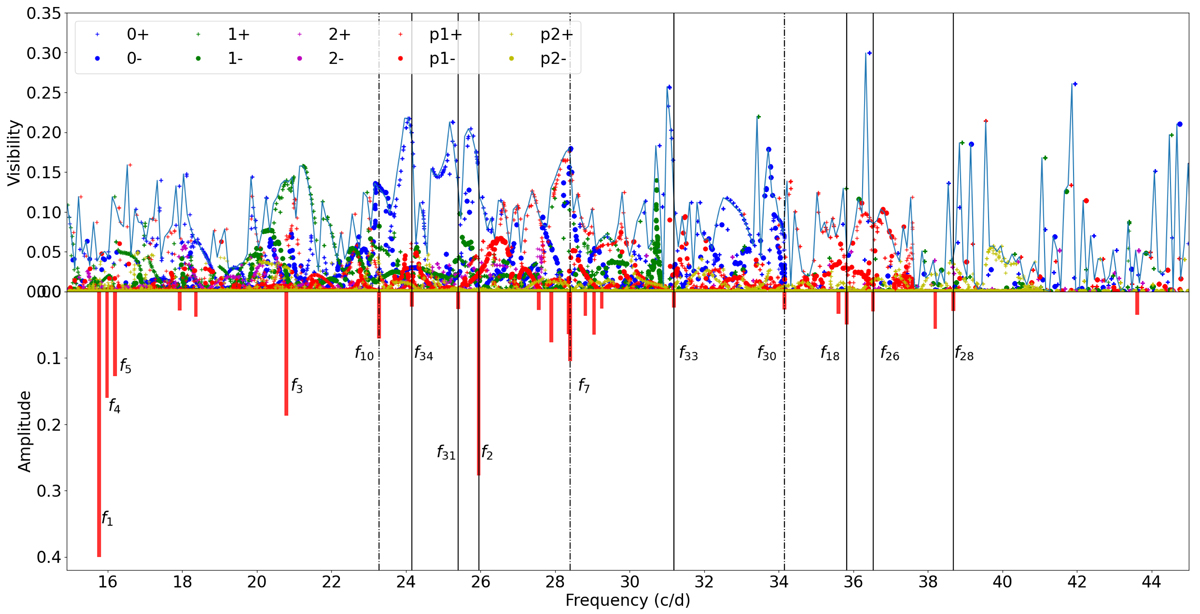
Global view of eigenmodes visibility of Altair’s concordance model. Upper part: proxy of visibility (see Eq. (4)) as a function of frequency for all modes computed with the TOP code using Altair’s concordance model of Bouchaud et al. (2020). The symbols show the individual values for each mode. Pluses (dots) designate modes that are symmetric (anti-symmetric) with respect to the equator. Colours indicate the azimuthal symmetry (see the legend), and p1+, p1−, p2+, p2− indicate prograde modes (i.e. negative m’s). The solid blue line is the envelope of the symbols using bins of 0.1 c/d. It highlights modes with high visibilities. Lower part: scaled amplitude (arbitrary unit) of observed frequencies (red bars). The thin vertical solid lines show possible identification of some 0+ modes. Thin vertical dot-dashed lines show the same for three 0− modes. Part of the frequencies have been annotated to ease location.
Current usage metrics show cumulative count of Article Views (full-text article views including HTML views, PDF and ePub downloads, according to the available data) and Abstracts Views on Vision4Press platform.
Data correspond to usage on the plateform after 2015. The current usage metrics is available 48-96 hours after online publication and is updated daily on week days.
Initial download of the metrics may take a while.