Fig. 10.
Download original image
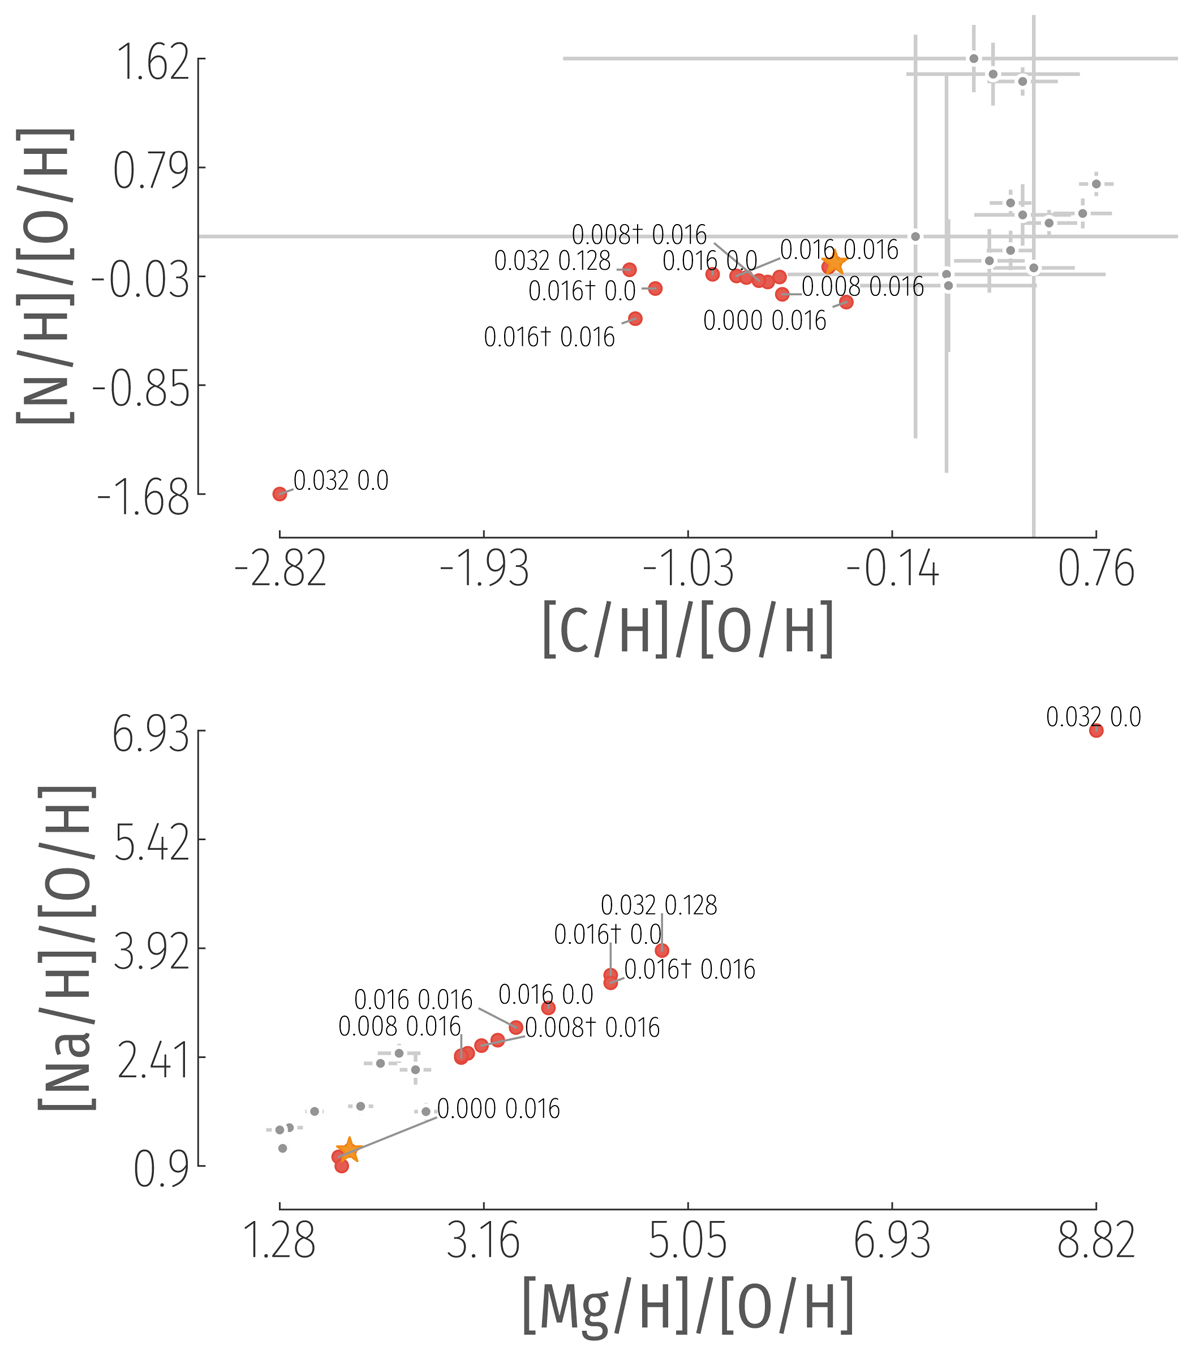
Abundance ratios of [N/H]/[O/H] vs. [C/H]/[O/H] (top) and [Na/H]/[O/H] vs. [Mg/H]/[O/H] (bottom). The gray points are the observations including errors where provided. The red points are the models in Table A.1. The point corresponding to the fiducial model is in orange and marked as a star. Some of the non-diluted points are labeled by the |fPDCZ| and |fCE| values for reference.
Current usage metrics show cumulative count of Article Views (full-text article views including HTML views, PDF and ePub downloads, according to the available data) and Abstracts Views on Vision4Press platform.
Data correspond to usage on the plateform after 2015. The current usage metrics is available 48-96 hours after online publication and is updated daily on week days.
Initial download of the metrics may take a while.