Open Access
Fig. 13
Download original image
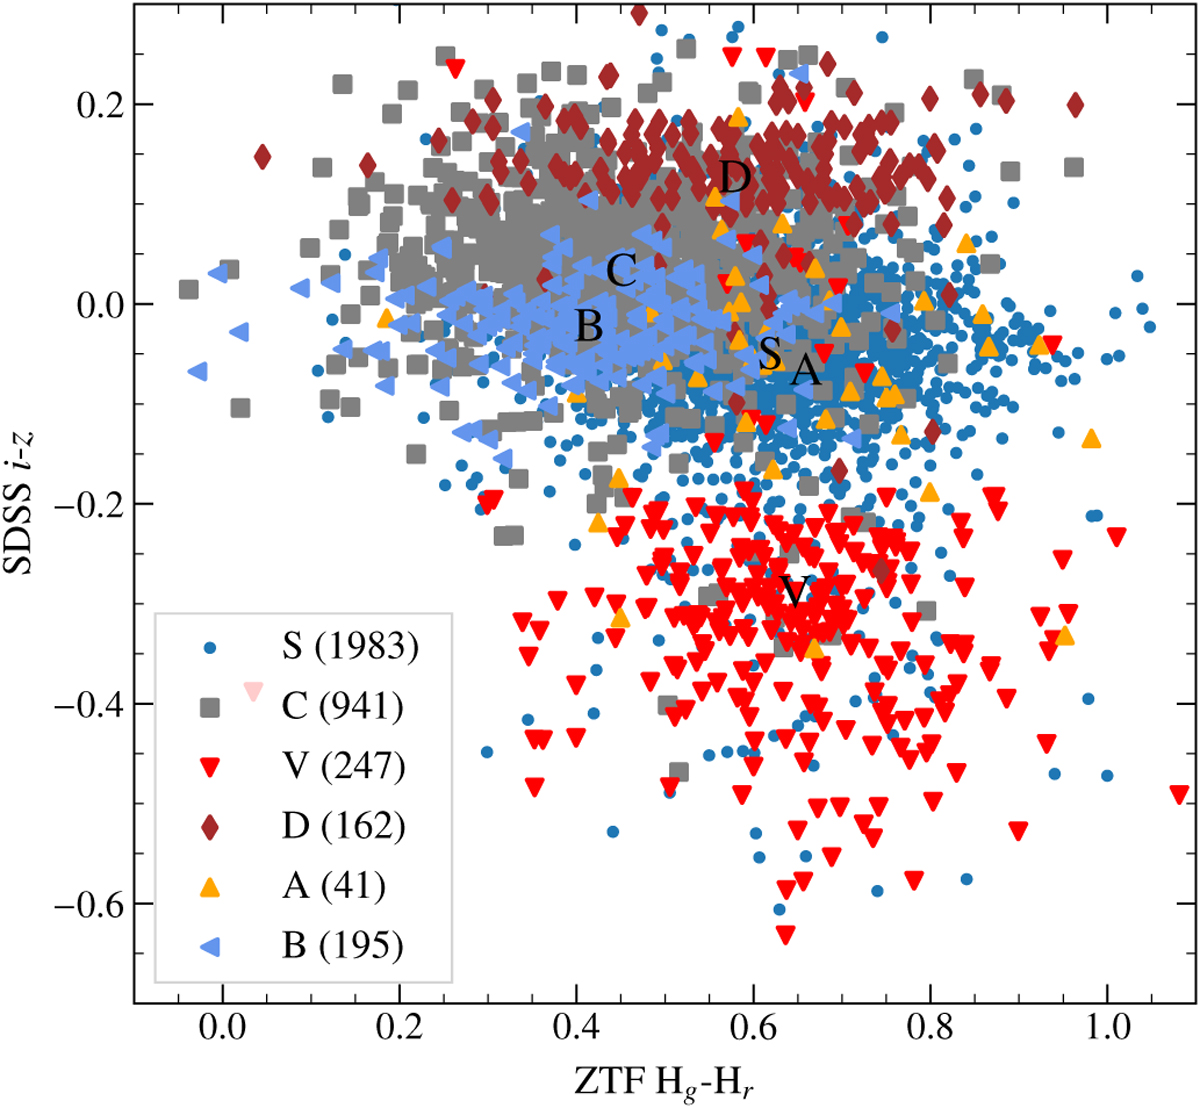
Distribution of 3569 SSOs in SDSS i-z against ZTF Hg–Hr. The symbols and colors correspond to the taxonomic class retrieved from SsODNet (Berthier et al. 2023), and the letter mark the average color for each class.
Current usage metrics show cumulative count of Article Views (full-text article views including HTML views, PDF and ePub downloads, according to the available data) and Abstracts Views on Vision4Press platform.
Data correspond to usage on the plateform after 2015. The current usage metrics is available 48-96 hours after online publication and is updated daily on week days.
Initial download of the metrics may take a while.