Fig. 9
Download original image
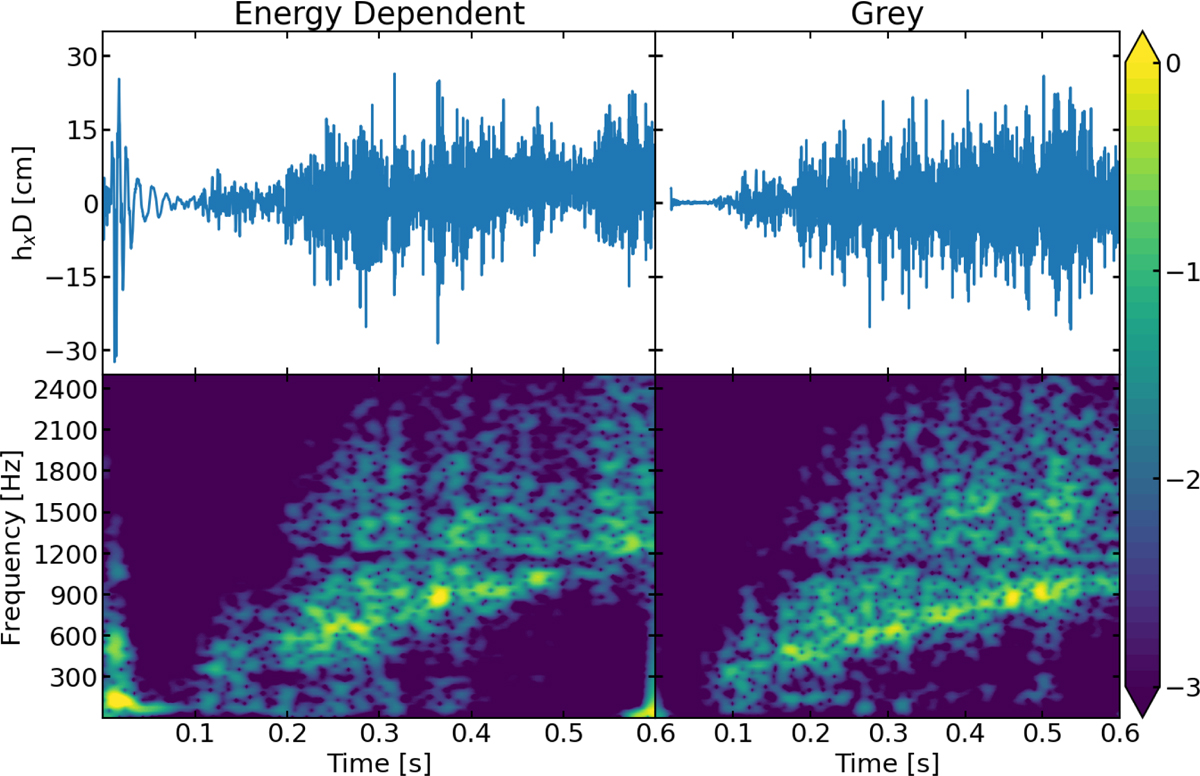
GWs from two simulations of the s12 progenitor. The right column shows the signals from the simulation with energy-dependent neutrino transport and the left column shows the corresponding simulation performed with our gray neutrino transport. The top row shows the strain as a function of time and the bottom row shows the square of the short time Fourier transform calculated with scipy.signal.stft (Virtanen et al. 2020). The color scale is logarithmic, and the plots were normalized by a common factor.
Current usage metrics show cumulative count of Article Views (full-text article views including HTML views, PDF and ePub downloads, according to the available data) and Abstracts Views on Vision4Press platform.
Data correspond to usage on the plateform after 2015. The current usage metrics is available 48-96 hours after online publication and is updated daily on week days.
Initial download of the metrics may take a while.