Fig. 8
Download original image
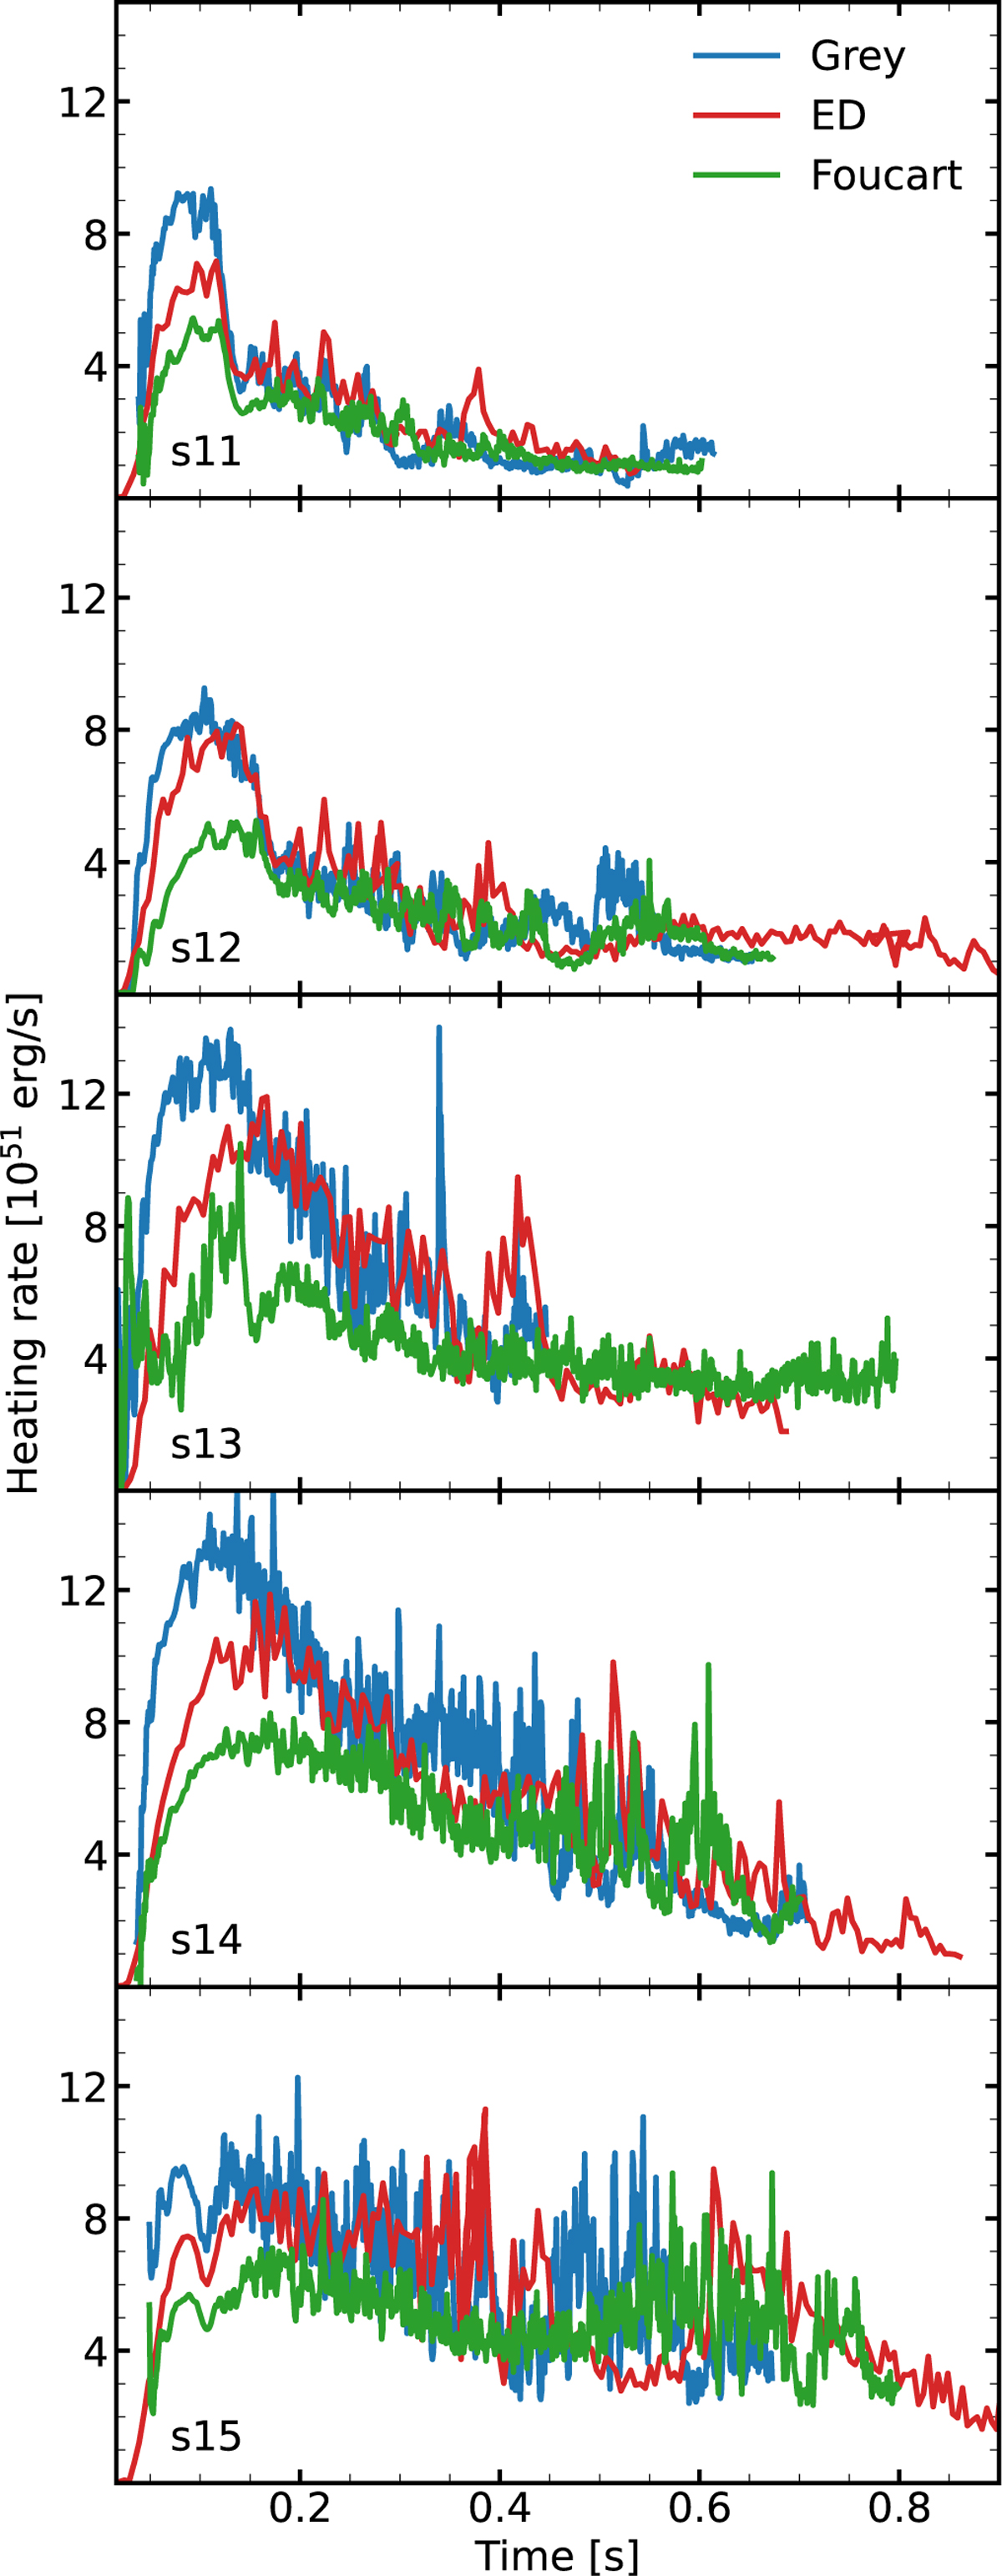
Heating rate as a function of time for models s11, s12, s13, s14, and s15. The blue curves indicate the results from simulations with our gray scheme, the green curves show the results from simulations using the neutrino transport of Foucart et al. (201 ), and the red curves correspond to the results from simulations with energy-dependent neutrino transport. Each row correspond to one model; the model names are shown in the bottom left corner of each panel.
Current usage metrics show cumulative count of Article Views (full-text article views including HTML views, PDF and ePub downloads, according to the available data) and Abstracts Views on Vision4Press platform.
Data correspond to usage on the plateform after 2015. The current usage metrics is available 48-96 hours after online publication and is updated daily on week days.
Initial download of the metrics may take a while.