Fig. 7
Download original image
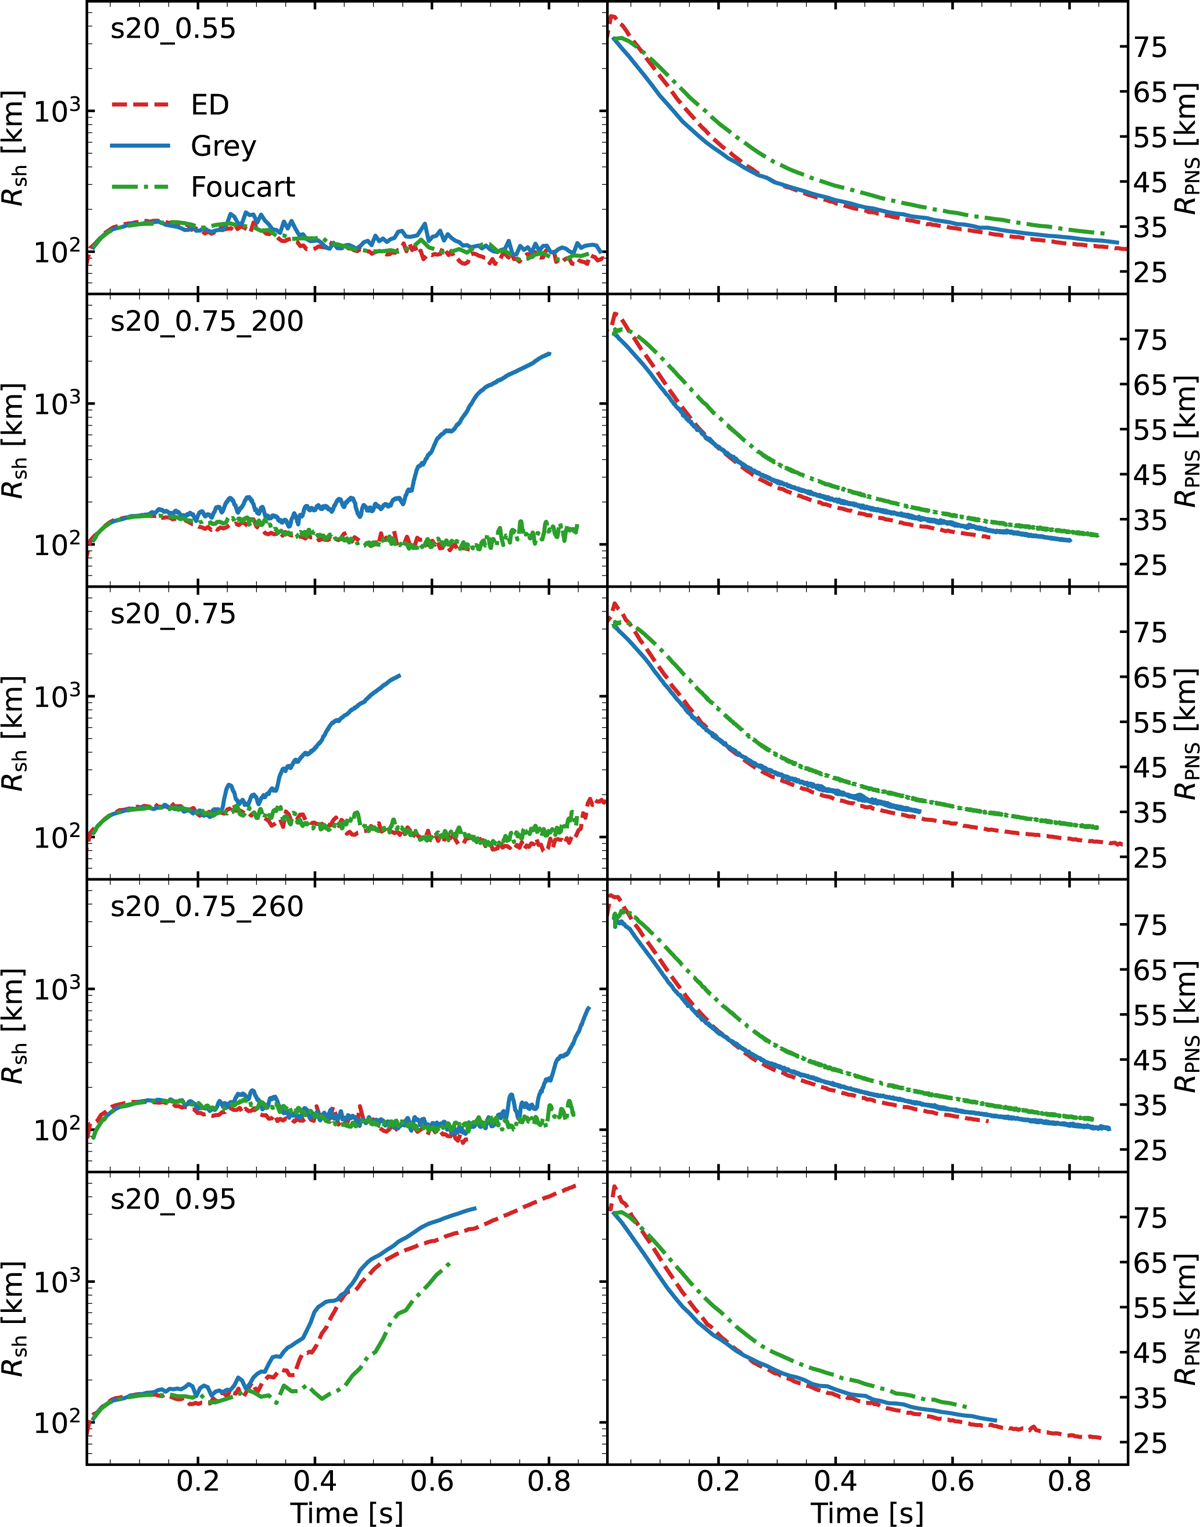
Average shock radius (left column) and the PNS radius (right column) for simulations based on one progenitor with a ZAMS mass of 20 solar masses. For each EOS we performed three simulations, one for each neutrino transport method. The dashed red line corresponds to simulations with fully energy-dependent transport, the green lines indicate simulations using the gray scheme of Foucart et al. (2016), and the blue lines show results from simulations using the gray transport proposed in this work. Each row corresponds to a given version of the SRO EOS; EOS parameters (see text) are indicated by the model name in the top left corner of each row.
Current usage metrics show cumulative count of Article Views (full-text article views including HTML views, PDF and ePub downloads, according to the available data) and Abstracts Views on Vision4Press platform.
Data correspond to usage on the plateform after 2015. The current usage metrics is available 48-96 hours after online publication and is updated daily on week days.
Initial download of the metrics may take a while.