Fig. 1
Download original image
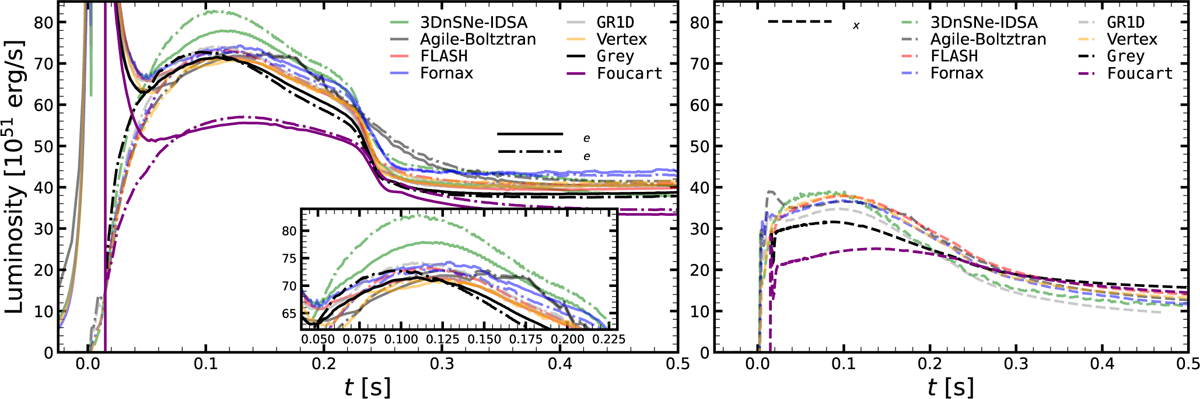
Neutrino luminosities for the gray simulation compared to the simulations presented in O’Connor et al. (2018; semitransparent colored lines). The purple lines indicate the results from the simulation based on the original gray transport from Foucart et al. (2016), and the black lines represent the result from the simulation using the improvements detailed in this work. The luminosity of the electron neutrinos (solid lines) and electron anti-neutrinos (dot-dashed lines) are shown in the left panel, and the luminosity of the heavy-lepton neutrinos is shown in the right panel (dashed lines). Time is given in seconds after bounce. The inset in the left panel shows a zoom-in of the peak centered around ~0.l s after bounce.
Current usage metrics show cumulative count of Article Views (full-text article views including HTML views, PDF and ePub downloads, according to the available data) and Abstracts Views on Vision4Press platform.
Data correspond to usage on the plateform after 2015. The current usage metrics is available 48-96 hours after online publication and is updated daily on week days.
Initial download of the metrics may take a while.