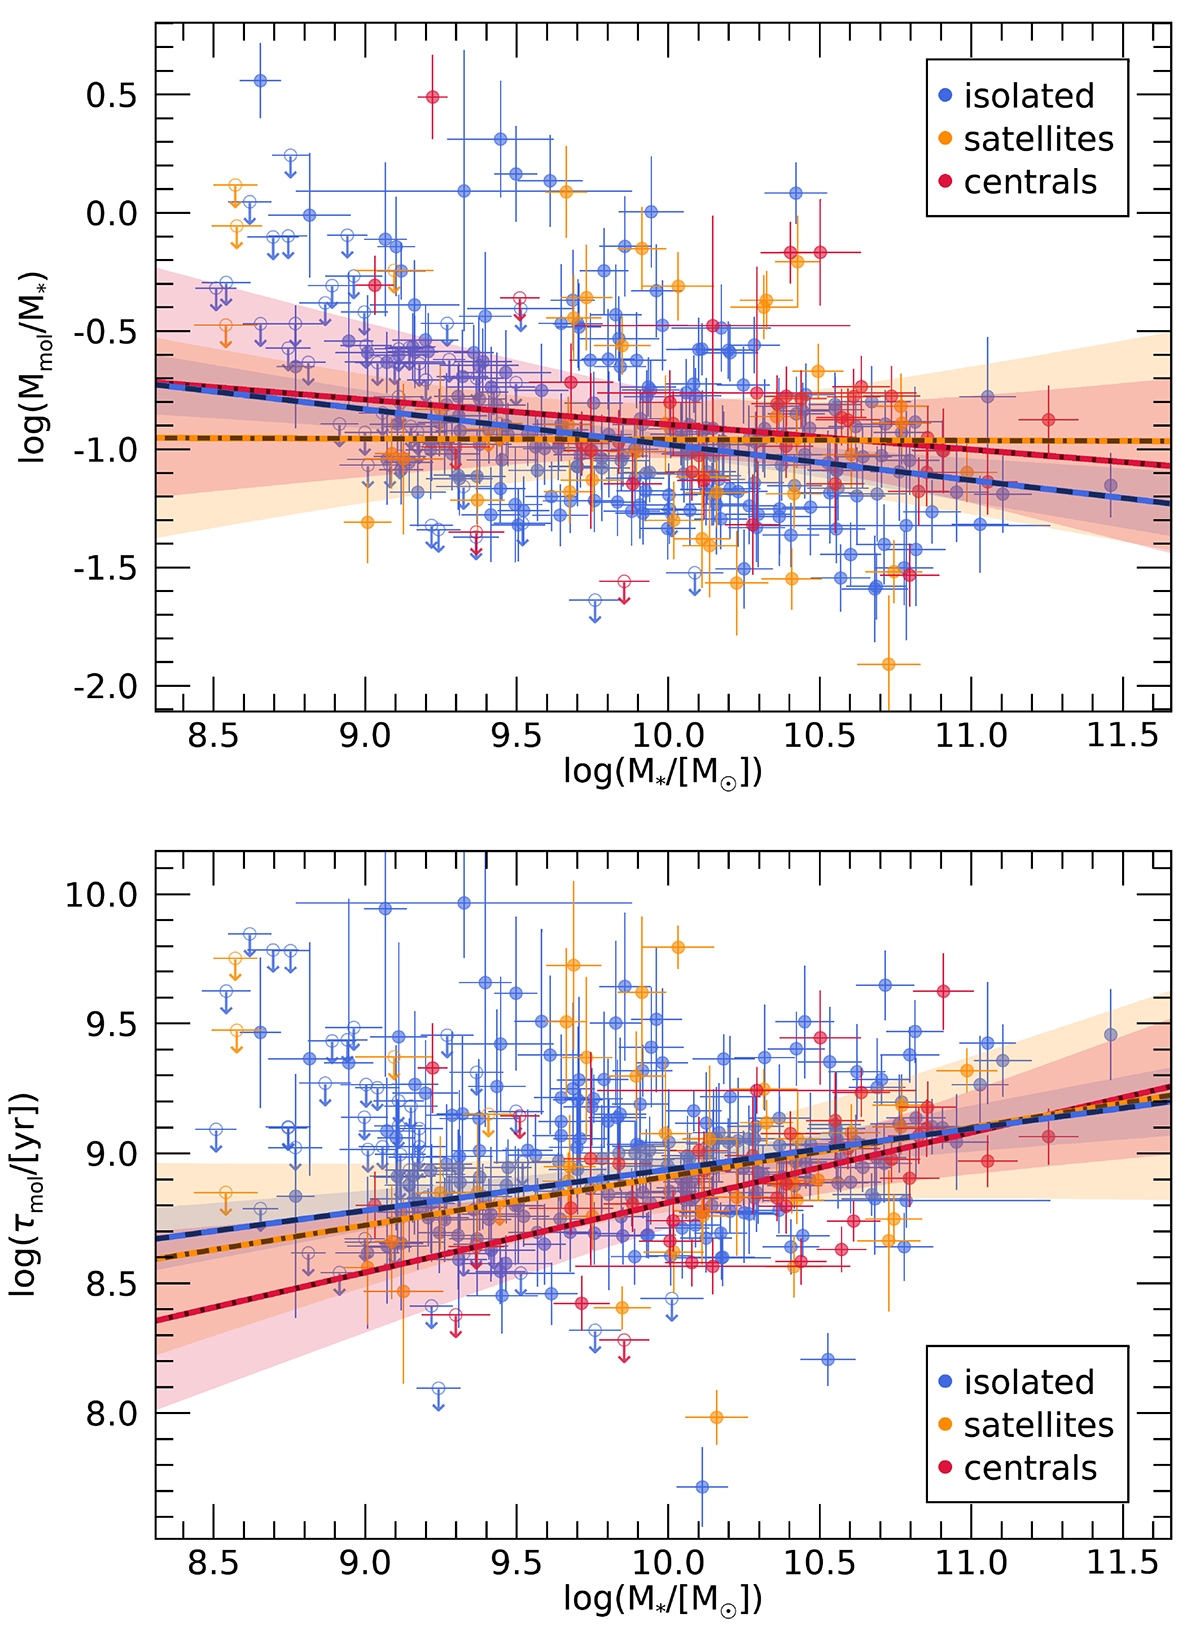
Fig. 9.
Download original image
Molecular gas scaling relations by environment. Top: molecular gas mass fraction vs. stellar mass by environment. Bottom: molecular gas depletion time vs. stellar mass by environment. The environment is classified as central (red), satellite (orange), and isolated (blue). The best fits from the Bayesian linear regression to the unbinned data are indicated by the blue-black-dashed (isolated), red-black-dotted (centrals), and orange-black-dash-dotted (satellites) lines respectively. The shaded areas indicate the 95% confidence bands. Open symbols with downward arrows denote upper limits. We note that for a few galaxies there was no environment information available from the group catalog.
Current usage metrics show cumulative count of Article Views (full-text article views including HTML views, PDF and ePub downloads, according to the available data) and Abstracts Views on Vision4Press platform.
Data correspond to usage on the plateform after 2015. The current usage metrics is available 48-96 hours after online publication and is updated daily on week days.
Initial download of the metrics may take a while.