Fig. 5.
Download original image
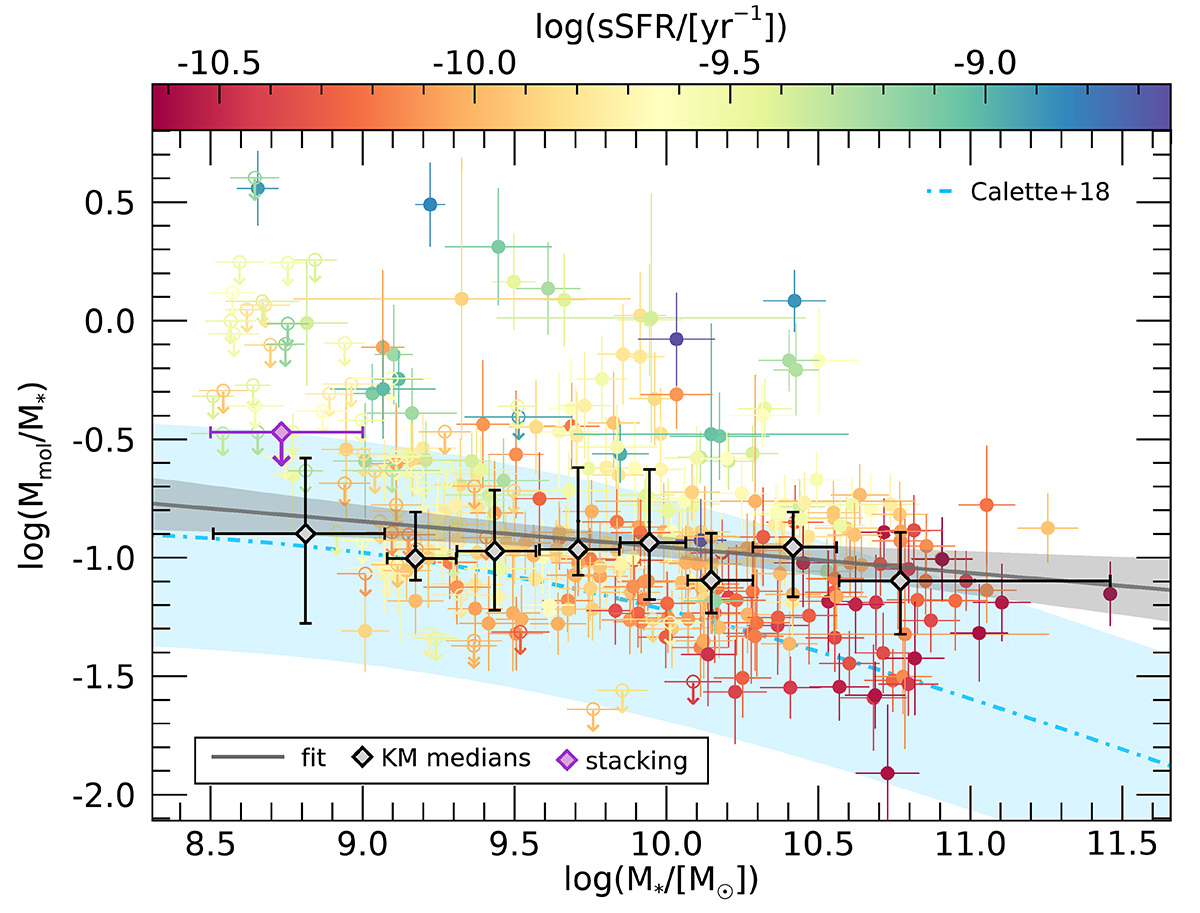
Molecular gas mass fraction vs. stellar mass for the star-forming sample. The solid gray line shows the best fit from the Bayesian linear regression to the unbinned data with the shaded area indicating the 95% confidence band. The black diamonds correspond to the binned medians computed using the Kaplan-Meier estimator. The associated error bars show the extent of the bin (in x) and the 25−75 percentile interval (in y). Open symbols with downward arrows denote upper limits. The purple diamond shows the upper limit derived from spectral stacking of the 22 ALLSMOG CO(2−1) non-detections with masses below M* = 109 M⊙. The blue dash-dotted line shows the scaling relations reported by Calette et al. (2018) based on their sample of late-type galaxies.
Current usage metrics show cumulative count of Article Views (full-text article views including HTML views, PDF and ePub downloads, according to the available data) and Abstracts Views on Vision4Press platform.
Data correspond to usage on the plateform after 2015. The current usage metrics is available 48-96 hours after online publication and is updated daily on week days.
Initial download of the metrics may take a while.