Fig. 4.
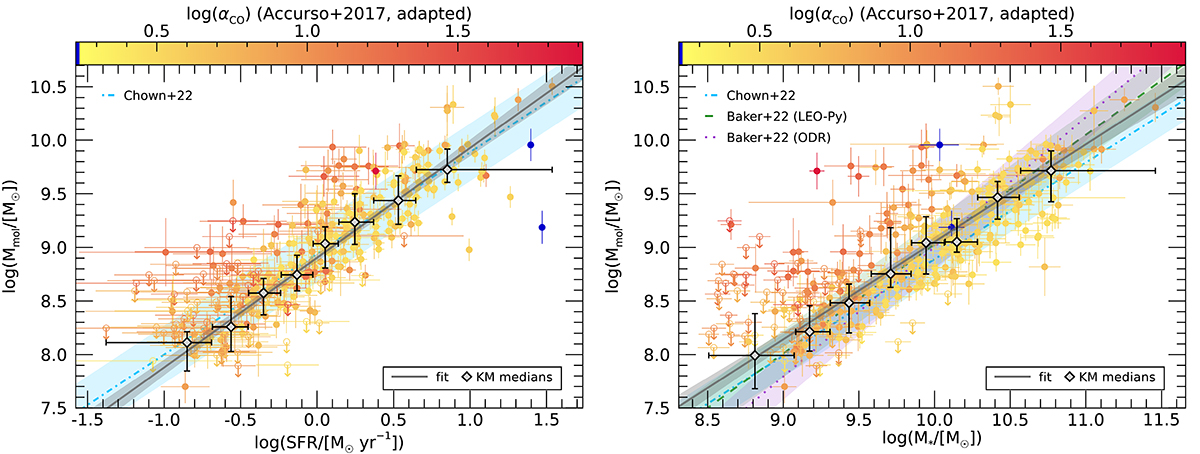
Download original image
Scaling relations of the molecular gas mass. Left: molecular gas mass vs. SFR for the star-forming sample. For comparison we show the integrated inverse Schmidt–Kennicutt relation (blue dash-dotted) and corresponding intrinsic scatter reported by Chown et al. (2022). Right: molecular gas mass vs. M*, with the best-fit MGMS from Chown et al. (2022) (blue dash-dotted) and Baker et al. (2022) with only detections (purple dotted) and detections and upper limits (green dashed). The color scale corresponds to the adopted CO-to-H2 conversion factor. In both panels the solid gray line shows the best fit from the Bayesian linear regression to the unbinned data with the shaded area indicating the 95% confidence band. The black diamonds correspond to the binned medians computed using the Kaplan-Meier estimator. The associated error bars show the extent of the bin (in x) and the 25−75 percentile interval (in y). Open symbols with downward arrows denote upper limits. The navy area of the color bar indicates the specific value of the conversion factor used for extreme starbursts as described in Sect. 2.5.
Current usage metrics show cumulative count of Article Views (full-text article views including HTML views, PDF and ePub downloads, according to the available data) and Abstracts Views on Vision4Press platform.
Data correspond to usage on the plateform after 2015. The current usage metrics is available 48-96 hours after online publication and is updated daily on week days.
Initial download of the metrics may take a while.