Fig. 1.
Download original image
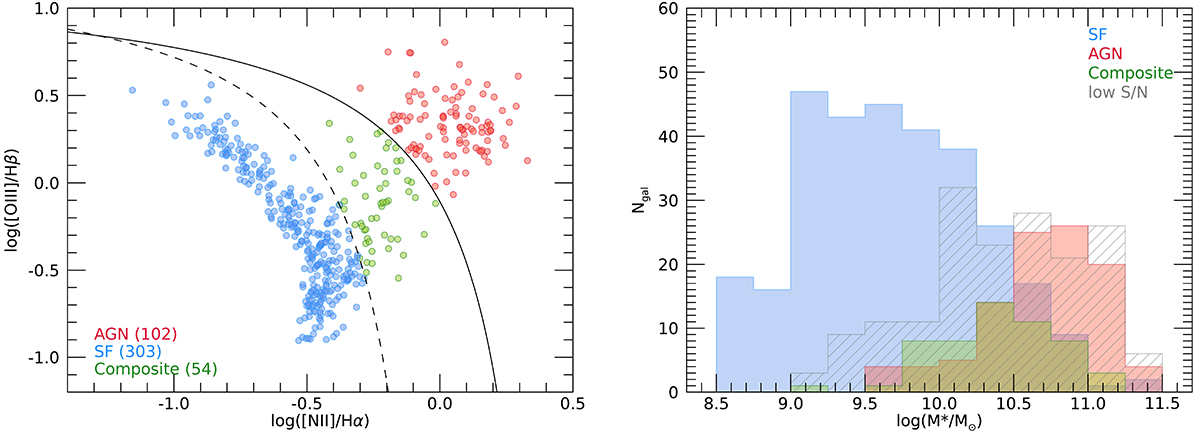
BPT classification of the sample. Left: BPT diagram of the full sample. The dashed line is the demarcation between pure SF galaxies and AGN or composite galaxies according to Kauffmann et al. (2003). The solid line is the theoretical limit for the ionization state produced by star formation according to Kewley et al. (2001), splitting the sample further into AGN and composite systems. Right: distribution of stellar masses in the SF, AGN, composite and low-S/N subsamples.
Current usage metrics show cumulative count of Article Views (full-text article views including HTML views, PDF and ePub downloads, according to the available data) and Abstracts Views on Vision4Press platform.
Data correspond to usage on the plateform after 2015. The current usage metrics is available 48-96 hours after online publication and is updated daily on week days.
Initial download of the metrics may take a while.