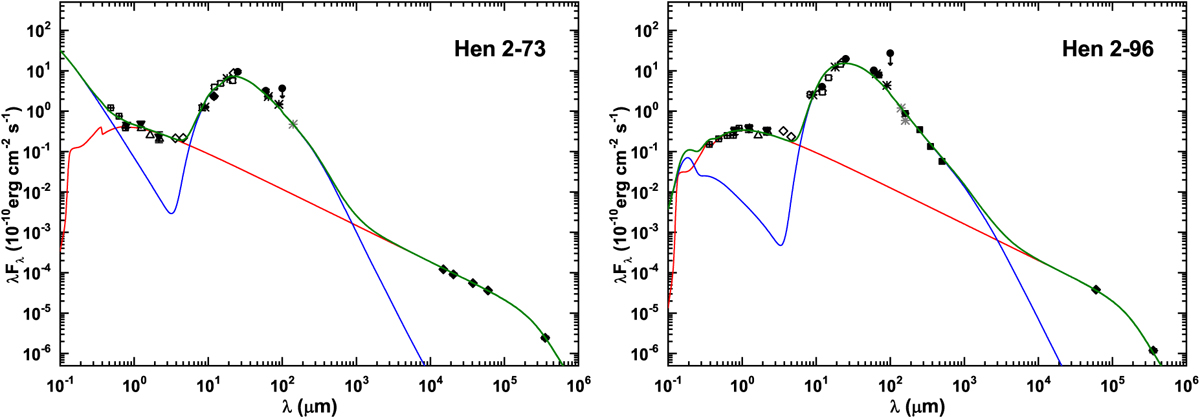
Fig. 8
Download original image
Composited SEDs of Hen 2-73 and Hen 2-96 from 100 nm to 1 m. SDSS u′, g′, r′, i′, and t′ data are represented as open squares, DENIS results as filled triangles, the 2MASS measurements as open triangles, WISE photometry as open diamonds, IRAS results as filled circles, MSX photometric measurements as open rhombuses, AKARI results as asterisks, Herschel detections as filled diamonds, and available radio results as filled rhombuses. Note that the IRAS measurements at 100 µm are upper limits and light asterisks represent the uncertain AKARI detections. The dust emissions estimated by using the radiation-transfer simulation and nebular-continuum contributions are plotted as blue and red lines. The green curves denote the total fluxes estimated from all components.
Current usage metrics show cumulative count of Article Views (full-text article views including HTML views, PDF and ePub downloads, according to the available data) and Abstracts Views on Vision4Press platform.
Data correspond to usage on the plateform after 2015. The current usage metrics is available 48-96 hours after online publication and is updated daily on week days.
Initial download of the metrics may take a while.