Open Access
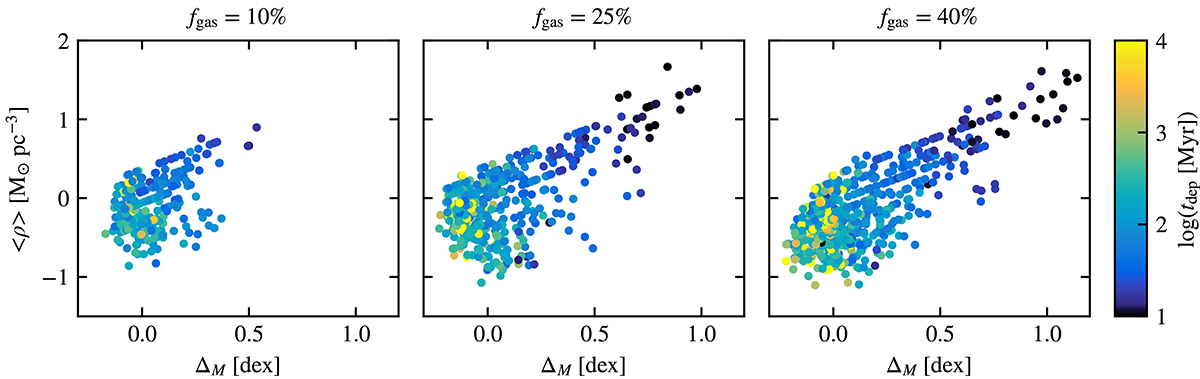
Fig. 9.
Download original image
Distributions of average density (total mass divided by total volume) and excess mass of the clumps, with color indicating the depletion time. Correlations between these three quantities are only found for the extreme clumps at high ΔM.
Current usage metrics show cumulative count of Article Views (full-text article views including HTML views, PDF and ePub downloads, according to the available data) and Abstracts Views on Vision4Press platform.
Data correspond to usage on the plateform after 2015. The current usage metrics is available 48-96 hours after online publication and is updated daily on week days.
Initial download of the metrics may take a while.