Fig. 7.
Download original image
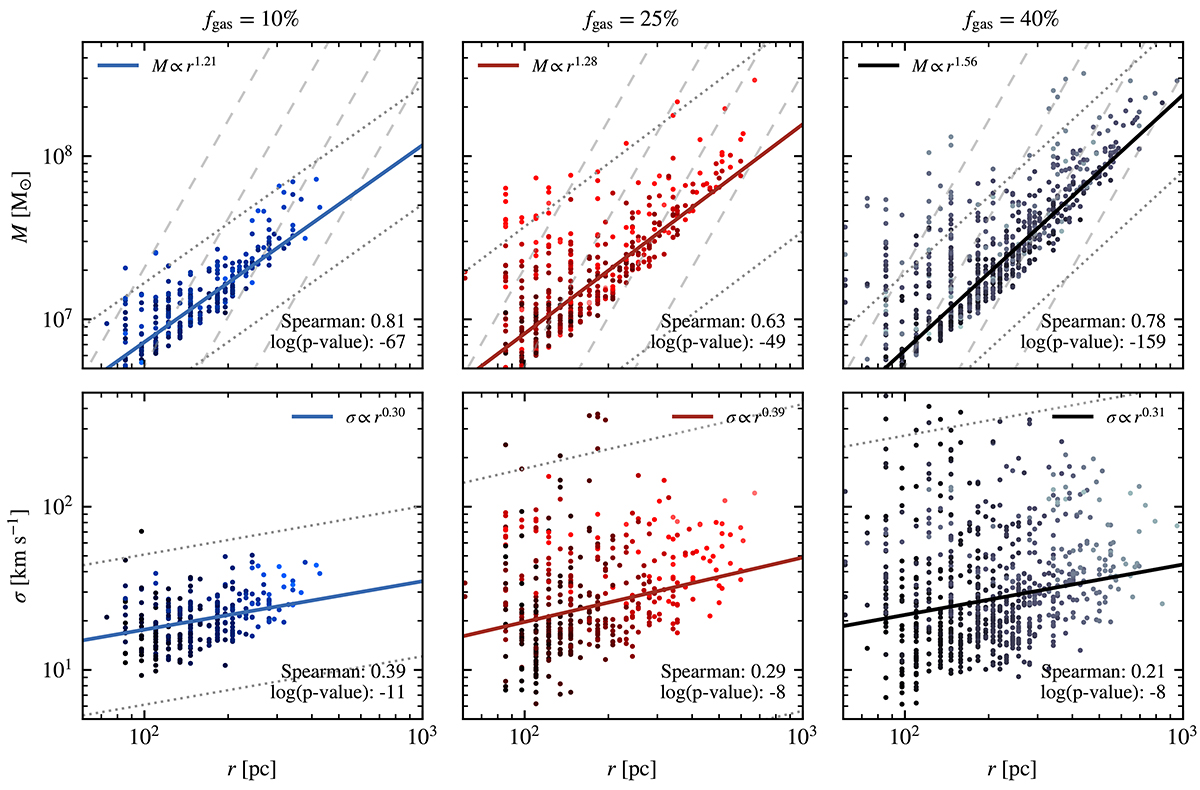
Mass–size (top) and velocity dispersion-size (bottom) relations for the clumps in our simulations. The color of the points encodes the logarithm of the third quantity (velocity dispersion on the top panels, and mass in the bottom row), increasing from dark to light. The solid lines are the least absolute deviation fittings of the linear relations in log-log space. They are translated into a power-law in linear-linear space, with the indexes indicated at the top of each panel. The dashed lines show constant densities, for reference, and the dotted lines mark the threshold for the robust identification of outliers (see text, Eq. (1)).
Current usage metrics show cumulative count of Article Views (full-text article views including HTML views, PDF and ePub downloads, according to the available data) and Abstracts Views on Vision4Press platform.
Data correspond to usage on the plateform after 2015. The current usage metrics is available 48-96 hours after online publication and is updated daily on week days.
Initial download of the metrics may take a while.