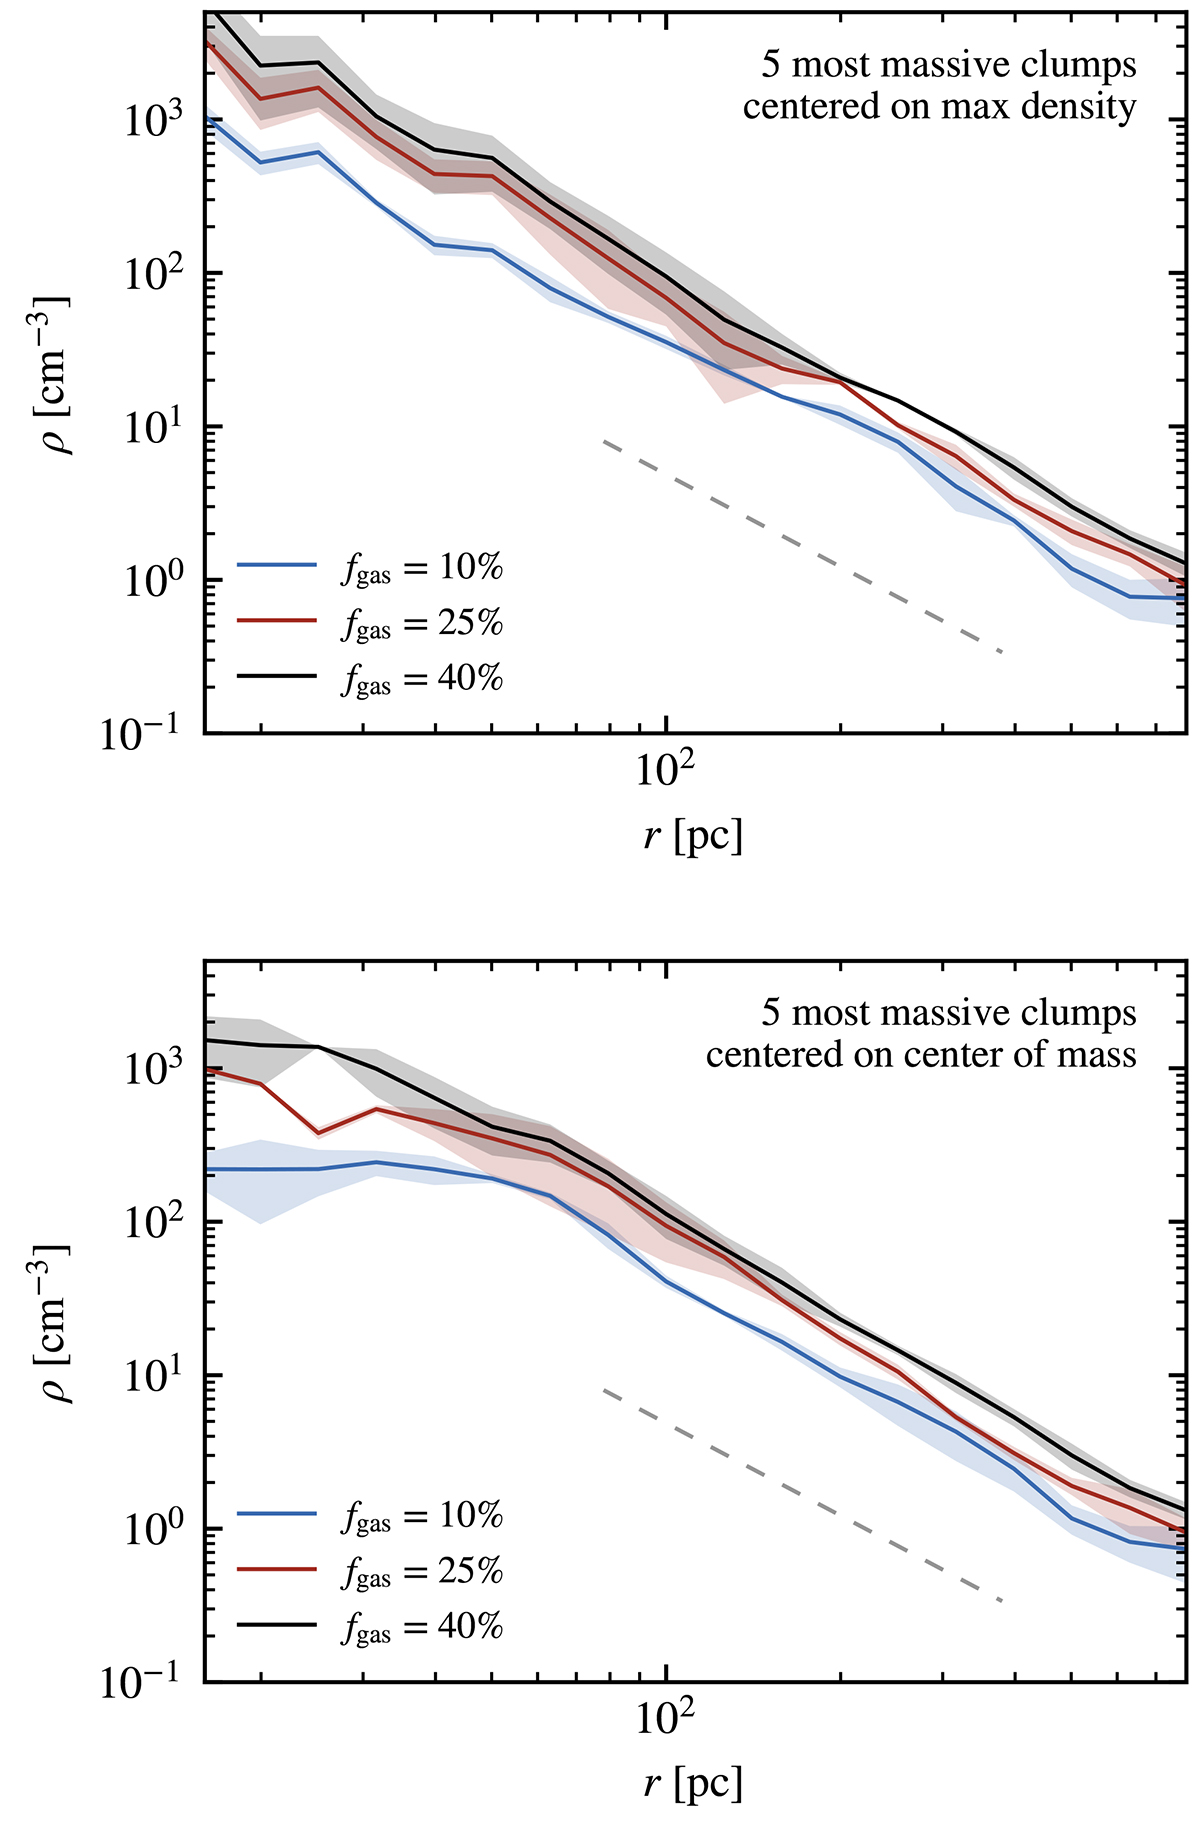
Fig. 5.
Download original image
Median density profile of the five most massive gas clumps in each simulation (excluding the central 2 kpc of the galaxies, where radial inflows at galactic scale play a non-negligible role in the accumulation of gas). The top panel shows the radial profiles with the maximum density as the center, and the bottom panel those centered on the center of mass. The shaded areas show the robust standard deviation over these 5 clumps. The dashed line represents a power-law of index −2, for reference.
Current usage metrics show cumulative count of Article Views (full-text article views including HTML views, PDF and ePub downloads, according to the available data) and Abstracts Views on Vision4Press platform.
Data correspond to usage on the plateform after 2015. The current usage metrics is available 48-96 hours after online publication and is updated daily on week days.
Initial download of the metrics may take a while.