Fig. 4.
Download original image
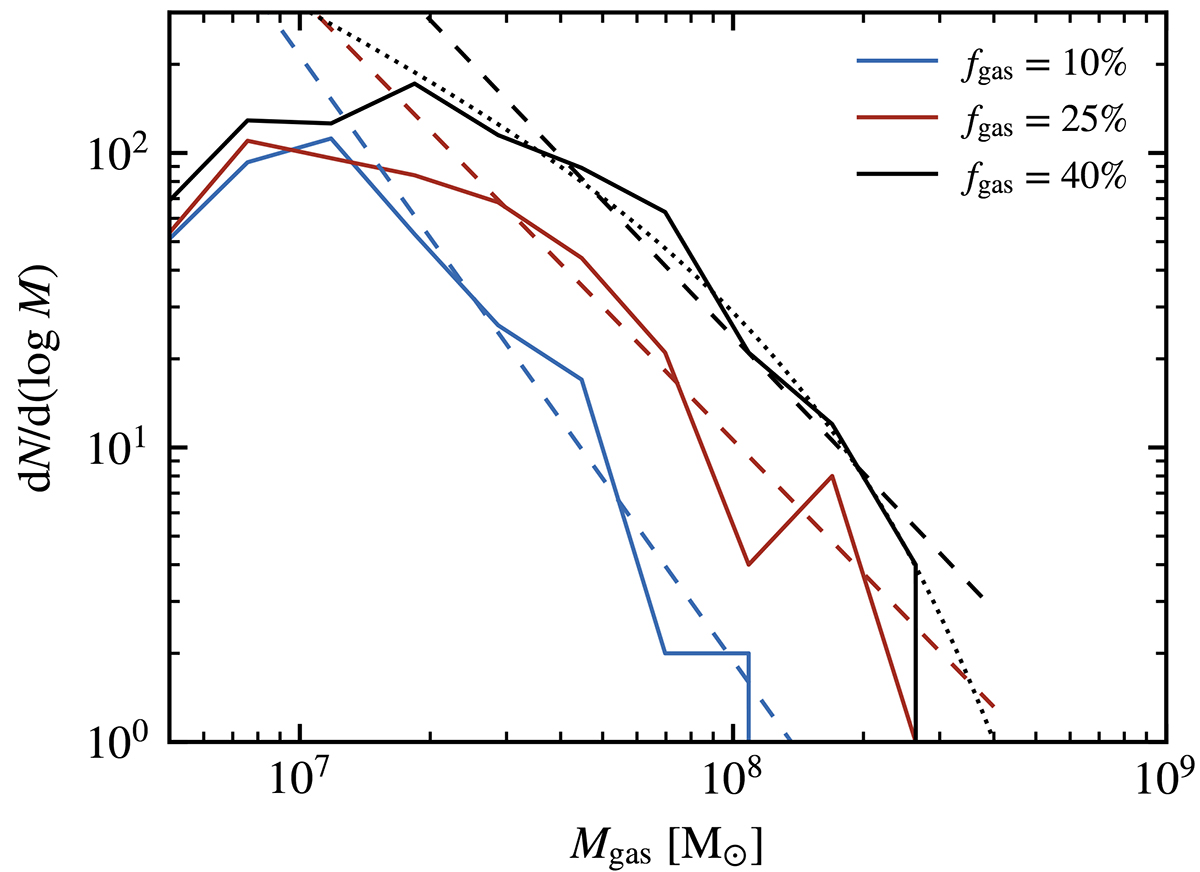
Clump mass functions for the three cases (using staking from 5 consecutive snapshots, to improve the statistics). The dashed lines indicate the best-fit of the high-mass end using a power-law. This gives indexes of −2.0, −1.5 and −1.6 for the ℱ10, ℱ25, and ℱ40 cases respectively. The dotted curves are fits to the data of fgas = 40% using a Schechter function (see text). This functional form does not provide a good match to the other cases.
Current usage metrics show cumulative count of Article Views (full-text article views including HTML views, PDF and ePub downloads, according to the available data) and Abstracts Views on Vision4Press platform.
Data correspond to usage on the plateform after 2015. The current usage metrics is available 48-96 hours after online publication and is updated daily on week days.
Initial download of the metrics may take a while.