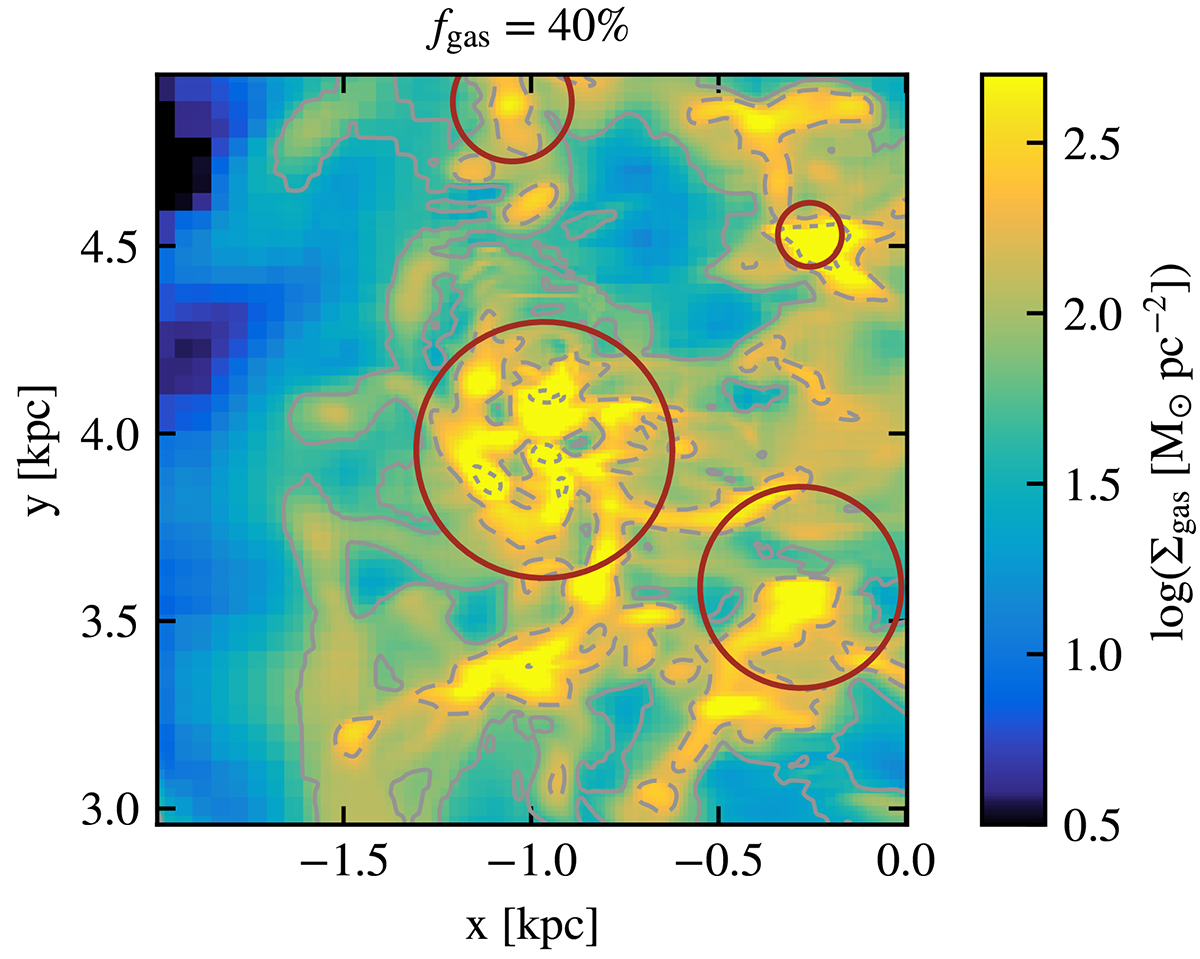
Fig. 2.
Download original image
Example of a massive clump hosting sub-structures, as a zoom-in on Fig. 1 (right panel, fgas = 40%). The contours indicate the surface densities of molecular gas at 10, 100 and 1000 M⊙ pc−2. The red circles shows our clump identification. As visible in this example, some of the largest clumps host clear sub-structures, which are inexistent in smaller clouds (either physically or because of limited numerical resolution).
Current usage metrics show cumulative count of Article Views (full-text article views including HTML views, PDF and ePub downloads, according to the available data) and Abstracts Views on Vision4Press platform.
Data correspond to usage on the plateform after 2015. The current usage metrics is available 48-96 hours after online publication and is updated daily on week days.
Initial download of the metrics may take a while.