Open Access
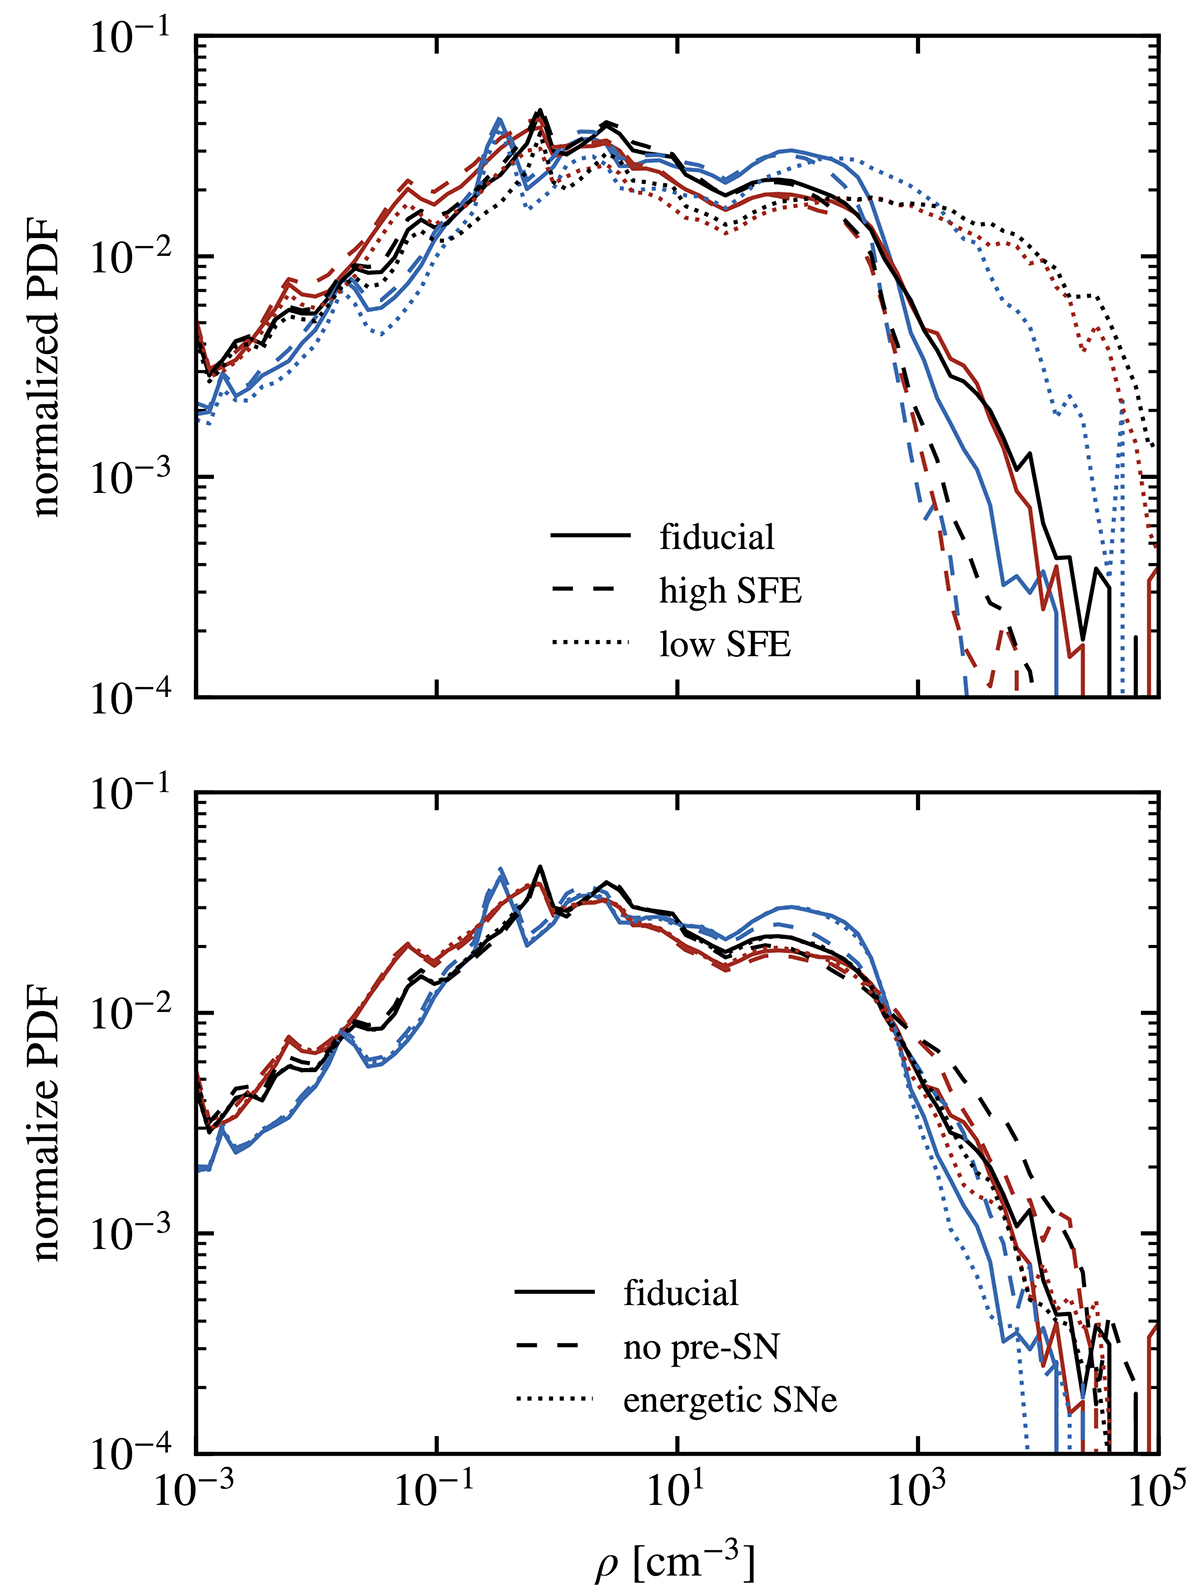
Fig. A.1.
Download original image
Gas density probability distribution function in all our 15 simulations. The color codes the gas fraction (10% in blue, 25% in red, 40% in black), and the line-style shows the modifications from the fiducial cases (solid lines, identical to Figure 3 of Paper I) as indicated in the legends.
Current usage metrics show cumulative count of Article Views (full-text article views including HTML views, PDF and ePub downloads, according to the available data) and Abstracts Views on Vision4Press platform.
Data correspond to usage on the plateform after 2015. The current usage metrics is available 48-96 hours after online publication and is updated daily on week days.
Initial download of the metrics may take a while.