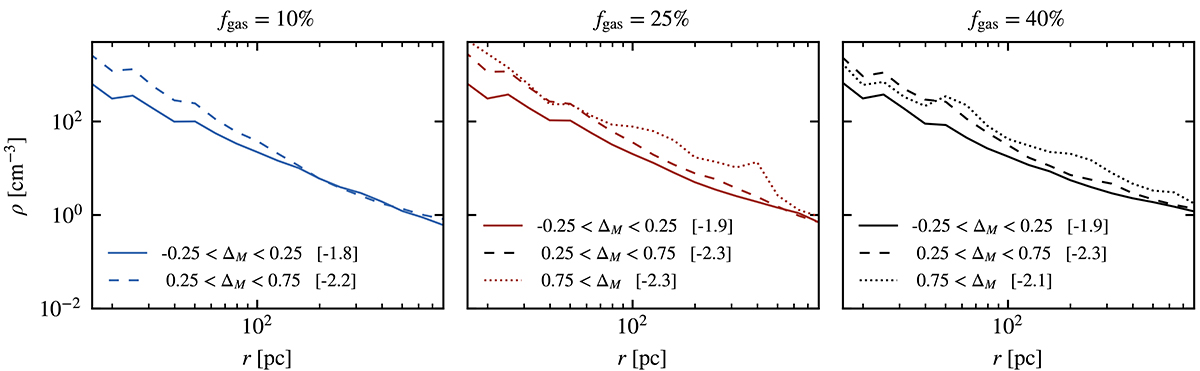
Fig. 10.
Download original image
Median density radial profiles of clumps of radius between 2 × 10⁷ M⊙ and 3 × 10⁷ M⊙, grouped in three bins of excess mass ΔM. The numbers in square brackets indicate the slope of each curve measured in log–log space in the inner 100 pc. (The conclusions do not change when considering larger radial ranges.) Higher excess masses correspond to more centrally concentrated clumps (steeper profiles).
Current usage metrics show cumulative count of Article Views (full-text article views including HTML views, PDF and ePub downloads, according to the available data) and Abstracts Views on Vision4Press platform.
Data correspond to usage on the plateform after 2015. The current usage metrics is available 48-96 hours after online publication and is updated daily on week days.
Initial download of the metrics may take a while.