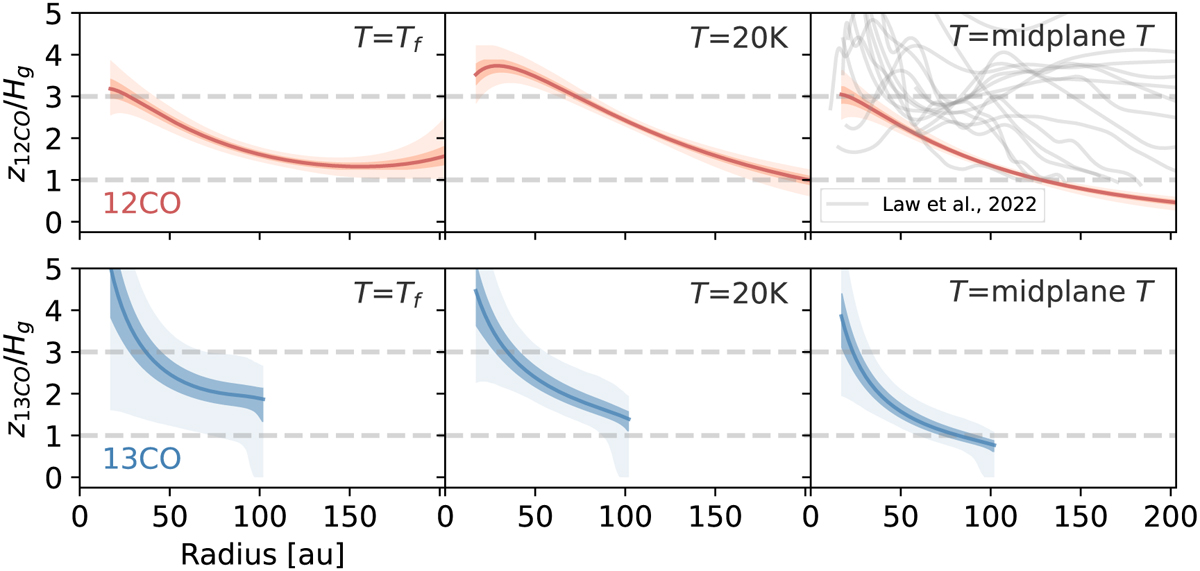
Fig. 7
Download original image
Ratio between the elevation of the emitting layer ɀ(r) over the expected pressure scale height H𝑔 for different midplane temperature prescriptions. Left: temperature profile equal to the front layer temperature of each isotopologue. Middle: temperature constant equal to 20 K. Right: temperature follows Eq. (7). The darker and lighter shaded regions represent the 1σ and 3σ uncertainty of each profile, respectively. The gray lines in the top right panel show the ɀ/H ratio from the disks analyzed in Law et al. (2022).
Current usage metrics show cumulative count of Article Views (full-text article views including HTML views, PDF and ePub downloads, according to the available data) and Abstracts Views on Vision4Press platform.
Data correspond to usage on the plateform after 2015. The current usage metrics is available 48-96 hours after online publication and is updated daily on week days.
Initial download of the metrics may take a while.