Fig. 5
Download original image
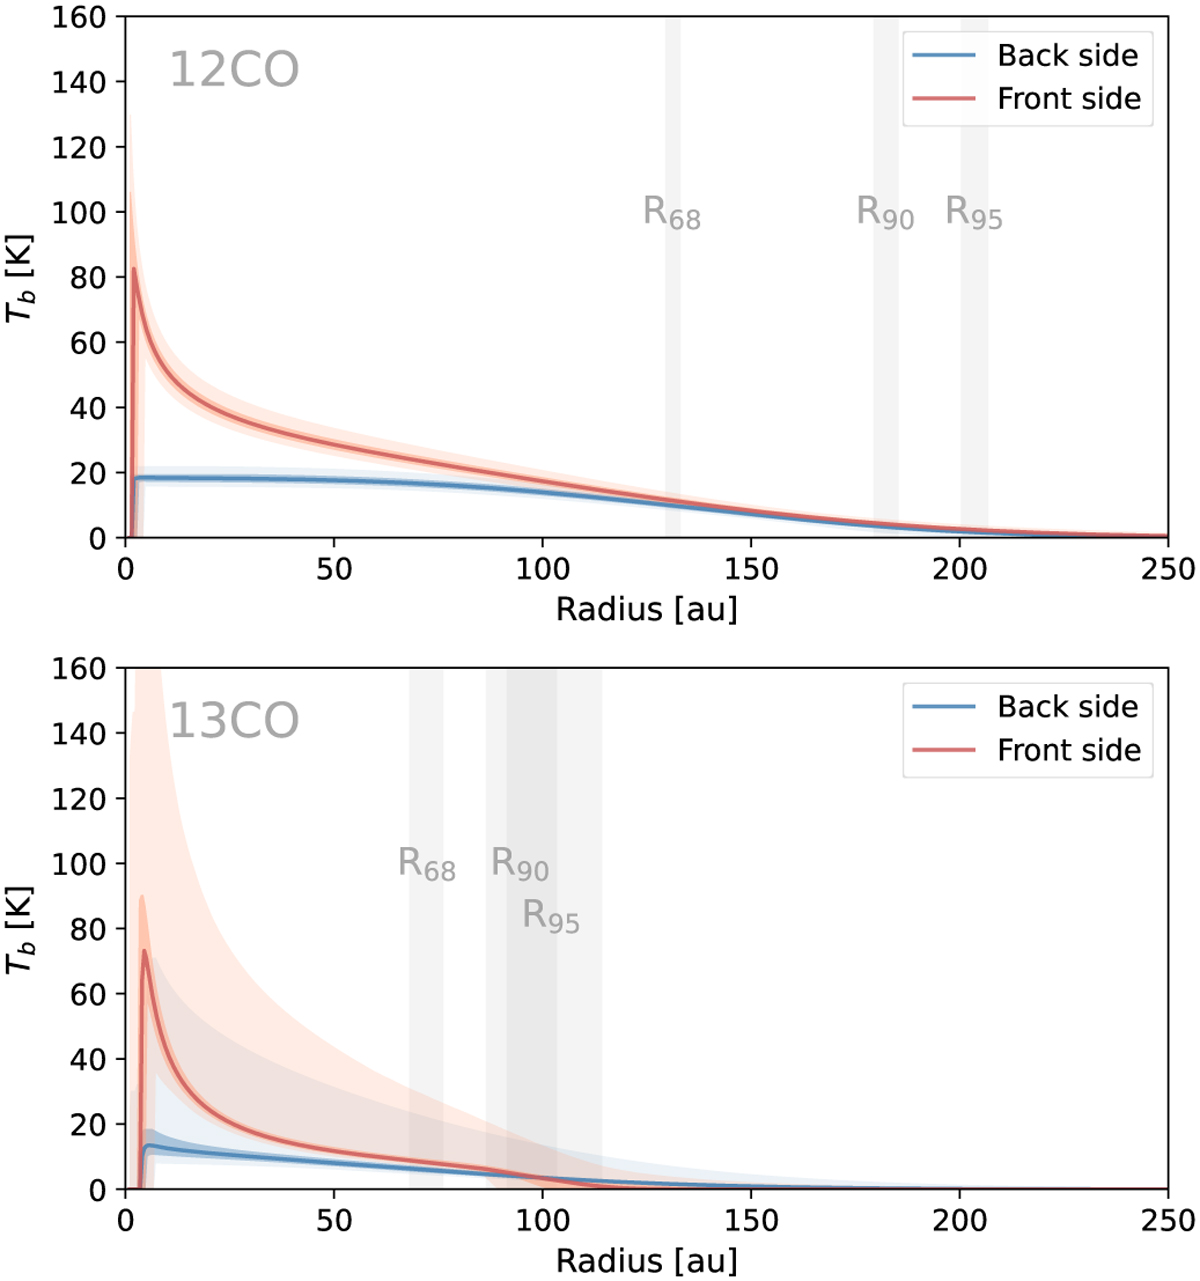
Azimuthally averaged brightness temperature profile for the 12CO and 13CO emission in the upper and lower panel, respectively. The darker and lighter shaded regions represent the 1σ and 3σ uncertainty of the brightness temperature, respectively. The solid line shows the best model. The vertical bands in grey show the 3σ radii region that includes the 68%, 90% and 95% of the emission.
Current usage metrics show cumulative count of Article Views (full-text article views including HTML views, PDF and ePub downloads, according to the available data) and Abstracts Views on Vision4Press platform.
Data correspond to usage on the plateform after 2015. The current usage metrics is available 48-96 hours after online publication and is updated daily on week days.
Initial download of the metrics may take a while.